


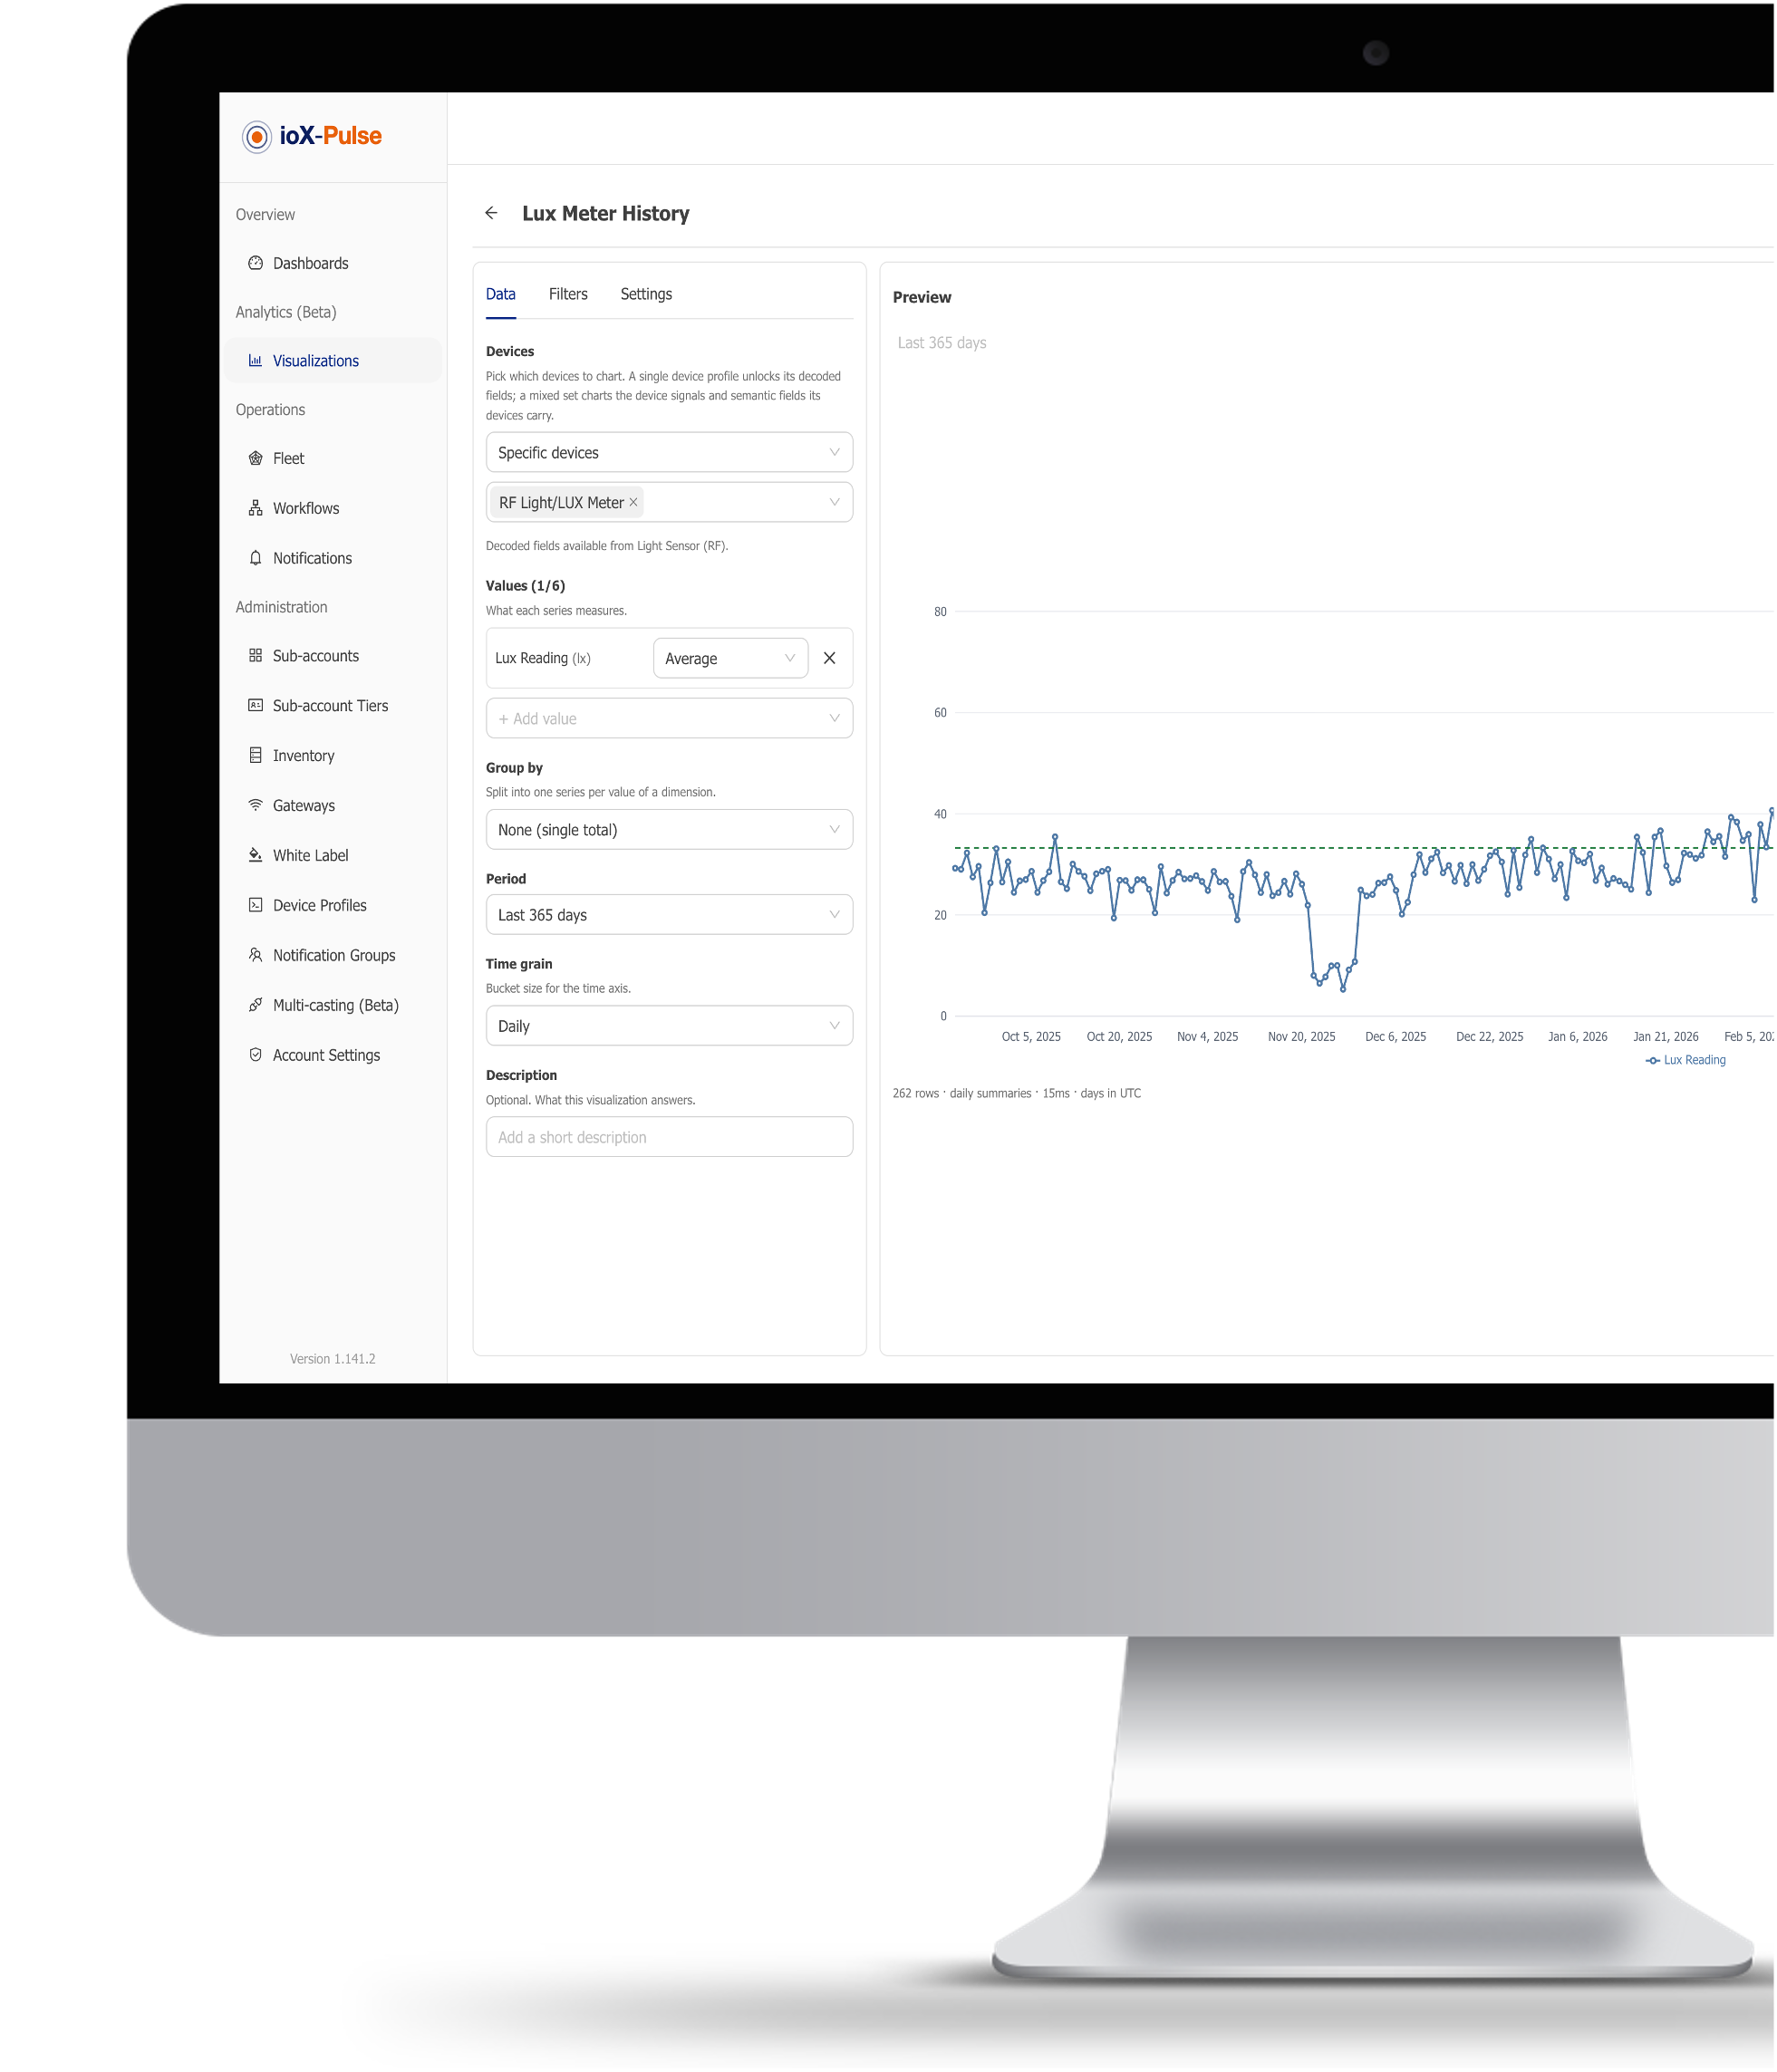
The analytics tools that work with a smart sensor network are the ones that sit inside the platform already receiving the readings, not general business intelligence tools bolted on afterwards. A sensor network does not produce tidy rows. It produces a decoded payload every few minutes from every device, at intervals that change, from devices that get recalibrated, moved and replaced. An analytics tool earns its place if it can handle that stream natively, compare many devices over a period, keep history stable when a calibration changes, and give the numbers back to you as a file. Everything else is a reporting tool wearing a different coat.
This guide walks through what to check. Where it describes ioX-Pulse behavior, the current record is the ioX-Pulse changelog.
Why sensor data breaks ordinary analytics tools
Take temperature and humidity sensors across a set of cold rooms, reporting every ten minutes over LoRaWAN. Almost none of the questions you want to ask are answerable one row at a time. You want the daily maximum per room across a quarter, the hours of the week when a room drifts, and which rooms behave alike. Three things make that hard for a general analytics tool:
- The payload is encoded. A LoRaWAN uplink arrives as bytes. Turning those bytes into a temperature requires the device's decoder, which belongs to the platform, not to a spreadsheet.
- Devices are not stable objects. Sensors get recalibrated, reporting intervals change, a unit fails and is swapped for another. A tool that assumes a fixed schema per device will show you a break that is not really there.
- Corrections have to reach history. If you apply an offset to a probe today, the number on the dashboard, the number that triggered last month's alert and the number on the chart all have to agree. Otherwise your analysis argues with your alerting.
The four things to check before you choose a tool
1. Does it read the decoded value, or the raw one? If the tool sits outside the platform, something has to decode the payload before it arrives, and you now maintain a decoding pipeline as well as a sensor network. Ask where decoding happens and who owns it when a manufacturer changes a firmware version.
2. Can it compare devices, not just show one? A single device chart is a dashboard feature. Analytics starts when you can put every device in a site on one chart, group them, and summarize them over a period: average, minimum, maximum, sum, count, latest, change. If the tool can only draw one device at a time, it will not answer the questions that justify the deployment.
3. How far back does the history go, and at what grain? Raw readings are expensive to keep and most platforms thin them out. The useful question is not how long raw data survives, but what summaries survive after it. Hourly and daily summaries are small, and a tool that keeps them for years can still answer a seasonal question long after the individual readings are gone.
4. Can you get the numbers out? Any serious analysis eventually leaves the tool. If a chart cannot hand you the rows behind it as a file, you will end up rebuilding the whole pipeline somewhere else the first time finance asks for a number.
Where the analysis belongs
The practical answer for most industrial sensor deployments is: in the platform that already receives the readings. It holds the decoders, the device history, the calibrations and the access rules. Moving the data somewhere else means rebuilding all four and keeping both copies in step.
There are real reasons to export. Combining sensor readings with production, billing or maintenance records is a data warehouse job. The test is whether you are answering a question about the sensors or a question about the business. Sensor questions belong where the sensors are, and the monitoring platform's job on the business side is to hand over clean, decoded numbers on request, through an API or a file.
How ioX-Pulse handles it
ioX-Pulse is the IoT monitoring software behind ioX-Connect sensor deployments, and Analytics in ioX-Pulse is currently in beta. It is a plan feature and it is off until your plan turns it on, so treat what follows as what the capability does rather than as something every account already has.
Against the four checks above:
- Decoding: the device profile decodes the payload when the reading arrives, so Analytics works on real values, not bytes. Formula fields and numeric mapping fields can be charted and filtered like any other reading.
- Comparison: visualizations are built across many devices at once, as bar, pie, scatter, line, area, heatmap or table, grouped by site, by device, by hour of the day or by day of the week in your own time zone. You can drill into a chart and save it to a library, then place a saved visualization on a dashboard beside your live tiles.
- History: hourly summaries are kept for a year by default and daily summaries for ten years, and those summaries are built for every account whether Analytics is switched on or not. That matters more than it sounds: history is already waiting on the day an account enables the feature.
- Getting data out: a download icon on a chart or a dashboard tile hands you the rows at the level you have drilled to, as CSV, and an author can turn that off for a specific visualization. A request that would return too many rows is refused with an explanation instead of being silently truncated.
On the recalibration problem: as of release 1.141.0, formulas, mappings and calibrations are computed as each reading arrives and stored with it, so the dashboard, the alert and the chart all show the same number, and applying a correction does not quietly rewrite what history used to say. Where you do want the correction applied backwards, that is a deliberate action rather than a side effect.
A short checklist
- Ask where payload decoding happens and who maintains it.
- Ask to see many devices on one chart, grouped and summarized, before you sign anything.
- Ask what summaries are retained and for how long, not just how long raw readings last.
- Ask to download the rows behind a chart.
- Ask what happens to old readings when a sensor is recalibrated.
- Ask who can see what, and whether that is enforced per site as well as per user.
FAQs
Four questions come up in nearly every evaluation of analytics for a sensor network. They are answered directly below.
Do I need a separate analytics tool for my sensor network?
Usually not, if you are asking questions about the sensors themselves. The platform receiving the readings already has the decoders, the device history and the access rules, so analysis there needs no second pipeline. A separate warehouse earns its place when you need to join sensor readings to production, billing or maintenance records.
Can I analyze data from sensors I did not buy from ioX-Connect?
Yes, on the Pulse Pro plan, which includes external sensor integration. The device profile library covers major LoRaWAN manufacturers and a profile can be built for a device that is not in it, and cellular NB-IoT and LTE-M devices are supported by IMEI.
How much sensor history do I need before analytics is useful?
Enough to cover the cycle you are trying to see. A daily temperature pattern shows up within a week. A seasonal one does not appear until you have the seasons, which is why retained summaries matter more than raw retention.
Is Analytics in ioX-Pulse available on every plan?
No. It is a beta feature and a plan feature, switched on per account. See ioX-Pulse plans for what each one includes, or Talk to an IoT Specialist about your deployment.
Next step
The fastest way to test the four checks above is on your own data. Talk to an IoT Specialist and we will walk through your deployment, or see ioX-Pulse plans.
Sources: the ioX-Pulse changelog and the ioX-Pulse product documentation, read on September 21, 2026, and the live ioX-Pulse plan page.
ioX-Connect
ioX-Connect is a comprehensive IoT Management Platform designed to streamline the monitoring of facilities and equipment.
Topics from this blog: IoT Analytics LoRaWAN IoT Industrial IoT IoT Platfrom