


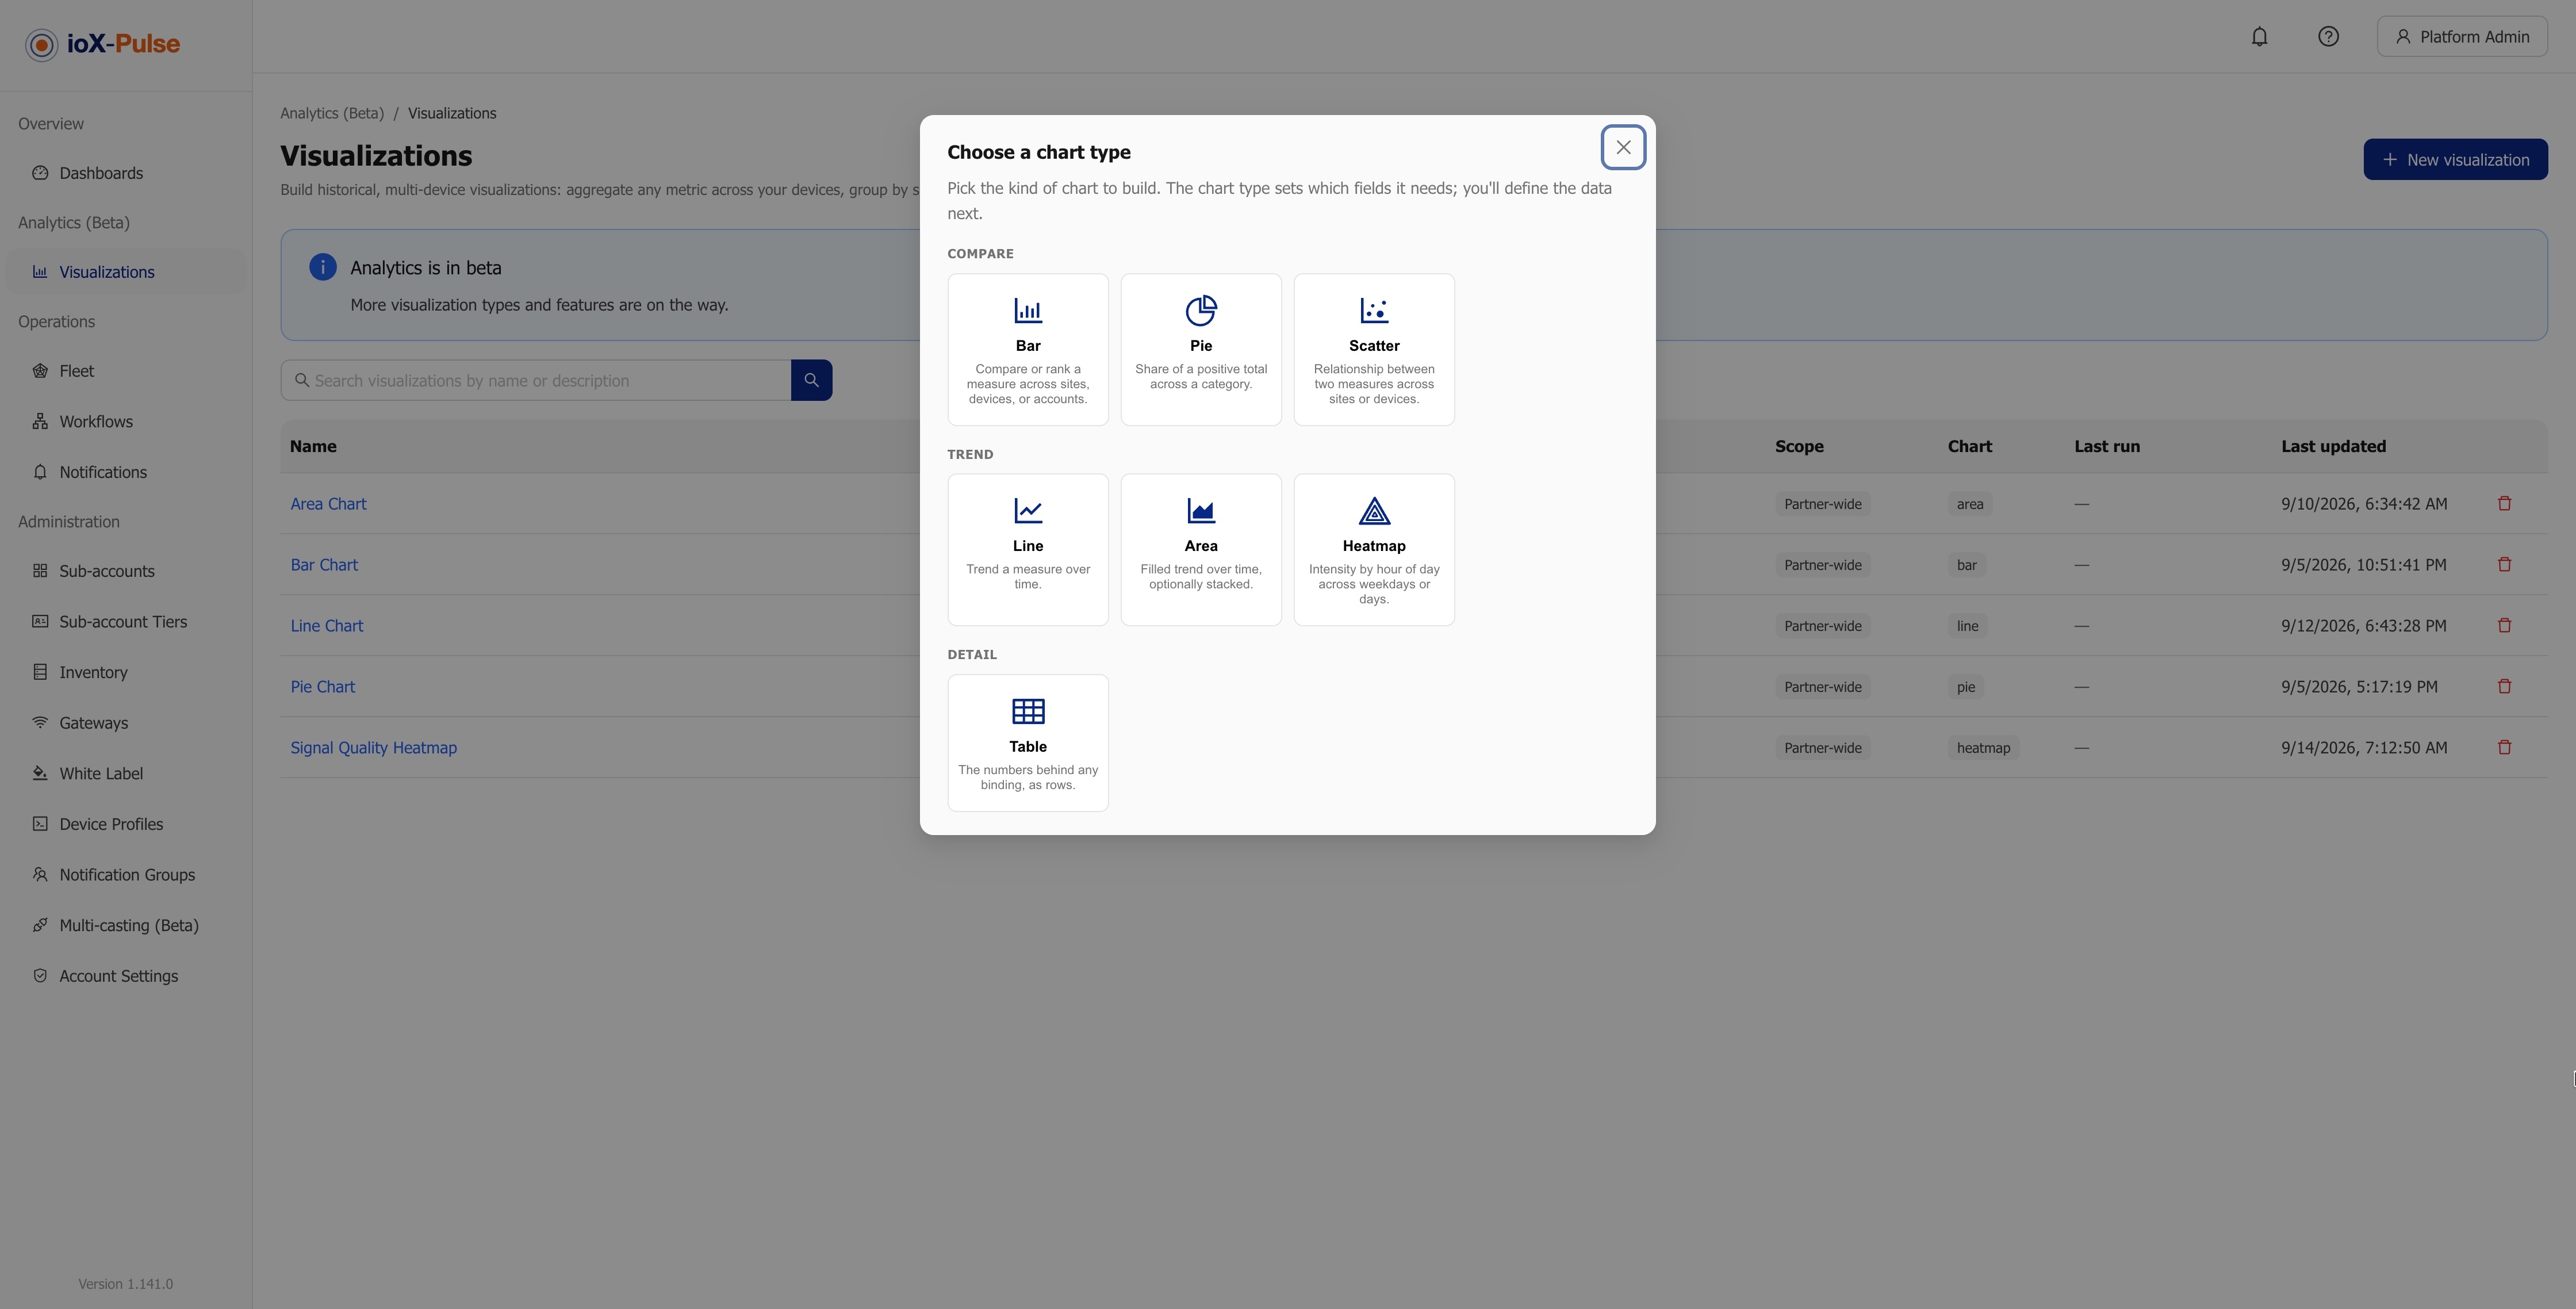
ioX-Pulse 1.141.4 rounds out the September release wave. Analytics (Beta) arrived earlier this month; 1.141.4 is the set of changes that makes it useful across your whole fleet: semantic fields, date pickers your viewers control, CSV downloads behind every chart, richer Value tiles, and fleet pins on the Geo map. The full list is in the ioX-Pulse changelog; this post covers what each change lets you do.
One signal, every profile: semantic fields
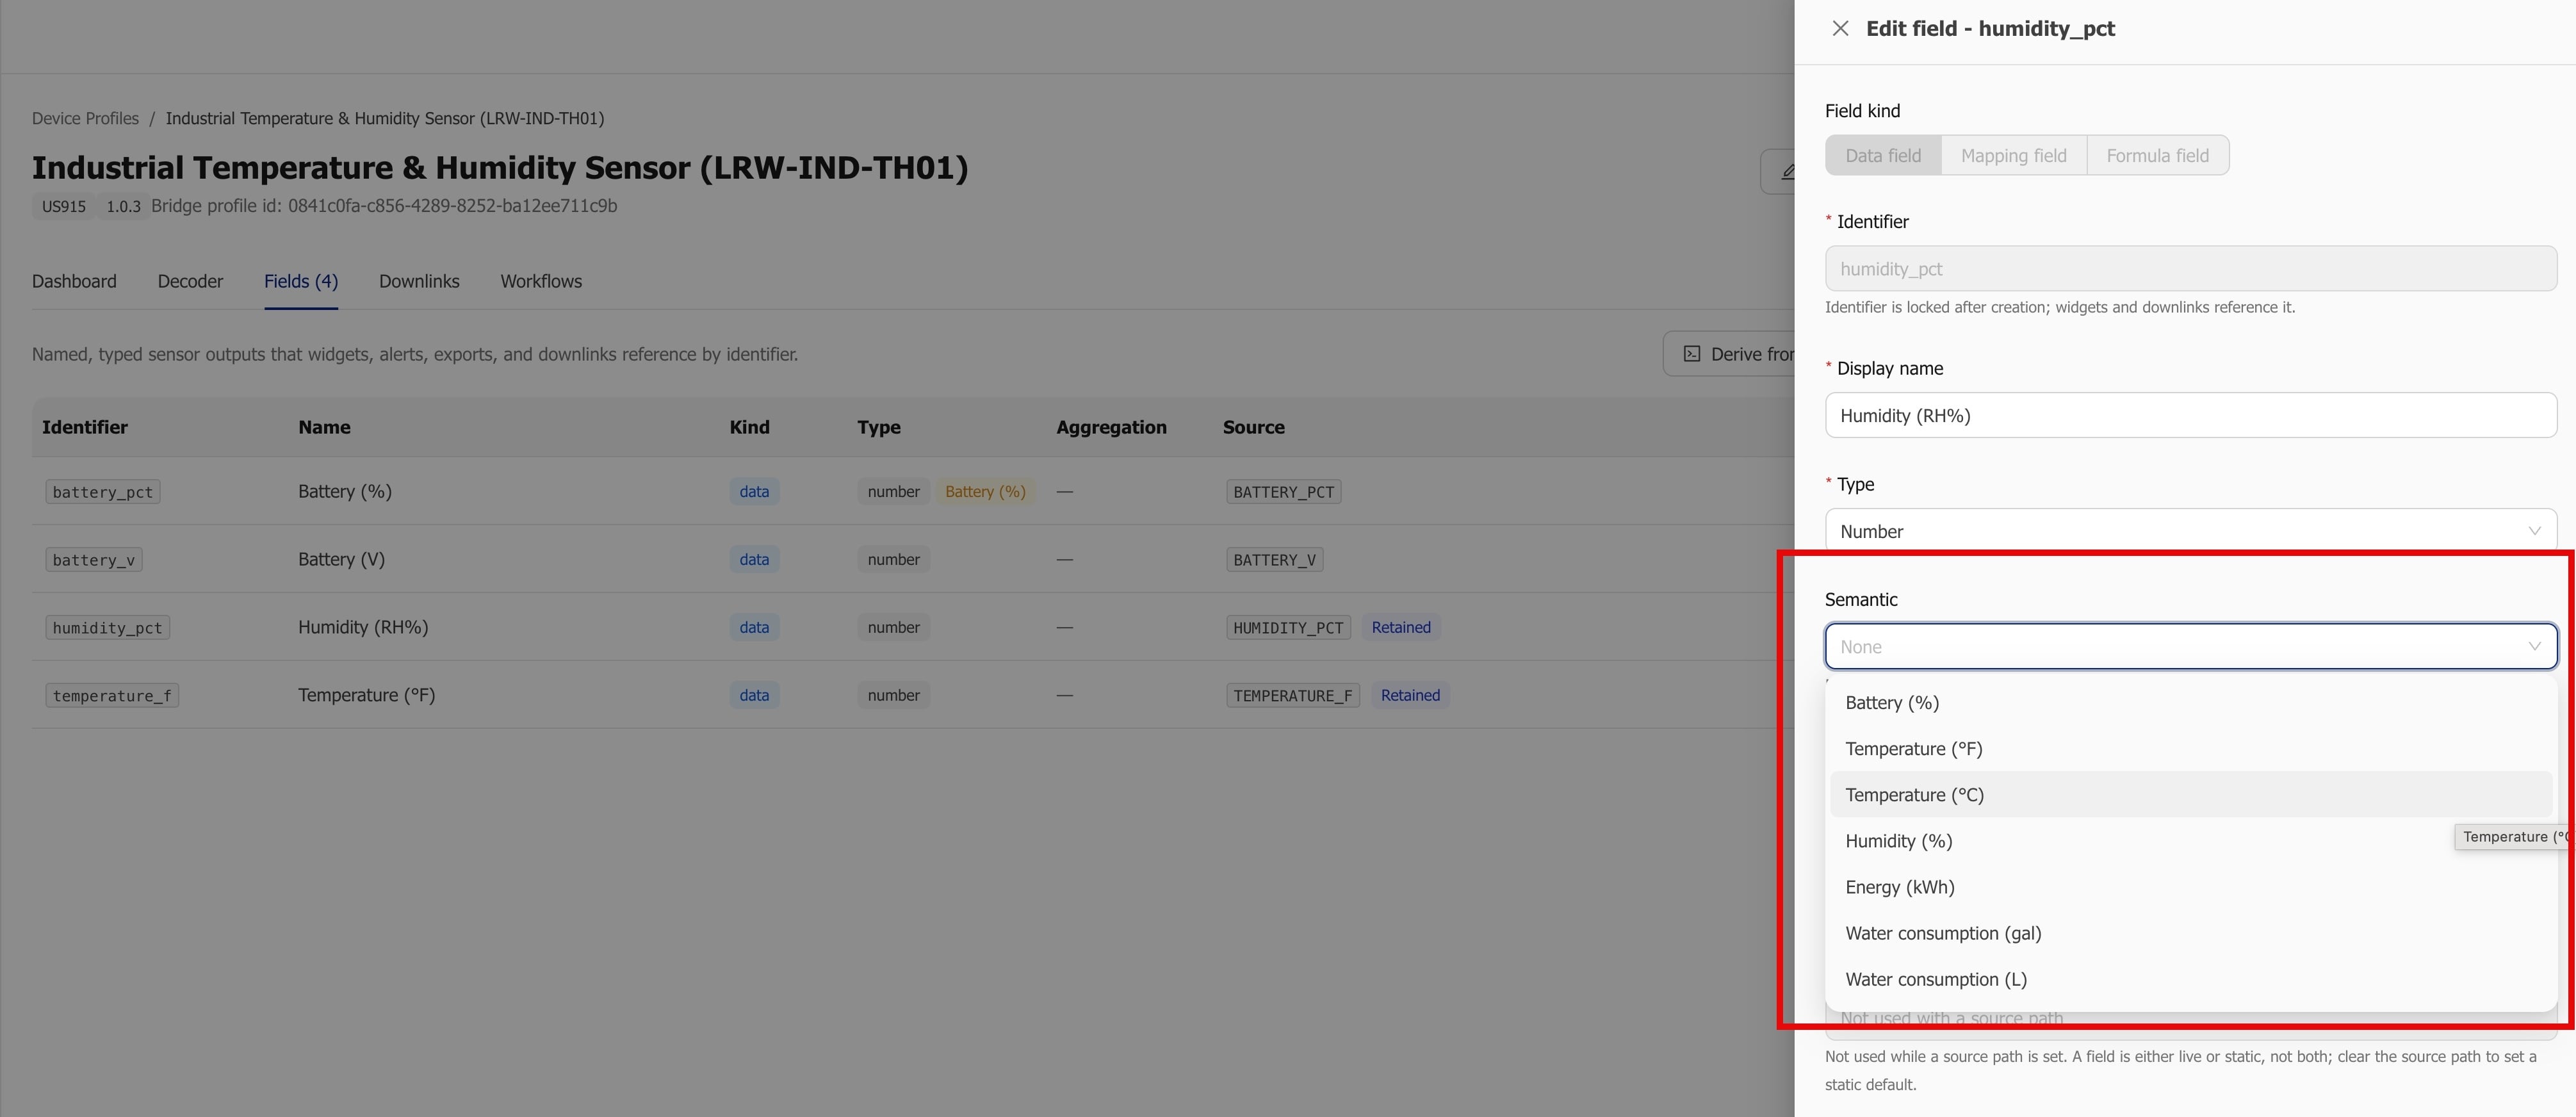
Your fleet probably mixes device models. A walk-in cooler sensor from one manufacturer and a warehouse sensor from another both report temperature, but until now a chart or a workflow had to be pointed at each profile's own field.
A semantic field fixes that. You mark one field per device profile as a common kind of reading, such as temperature or humidity, and Analytics, the Count widget and workflows read that signal from every profile at once. One chart of overnight temperatures across every cold room you run, whatever hardware is inside them.
Viewers pick their own period
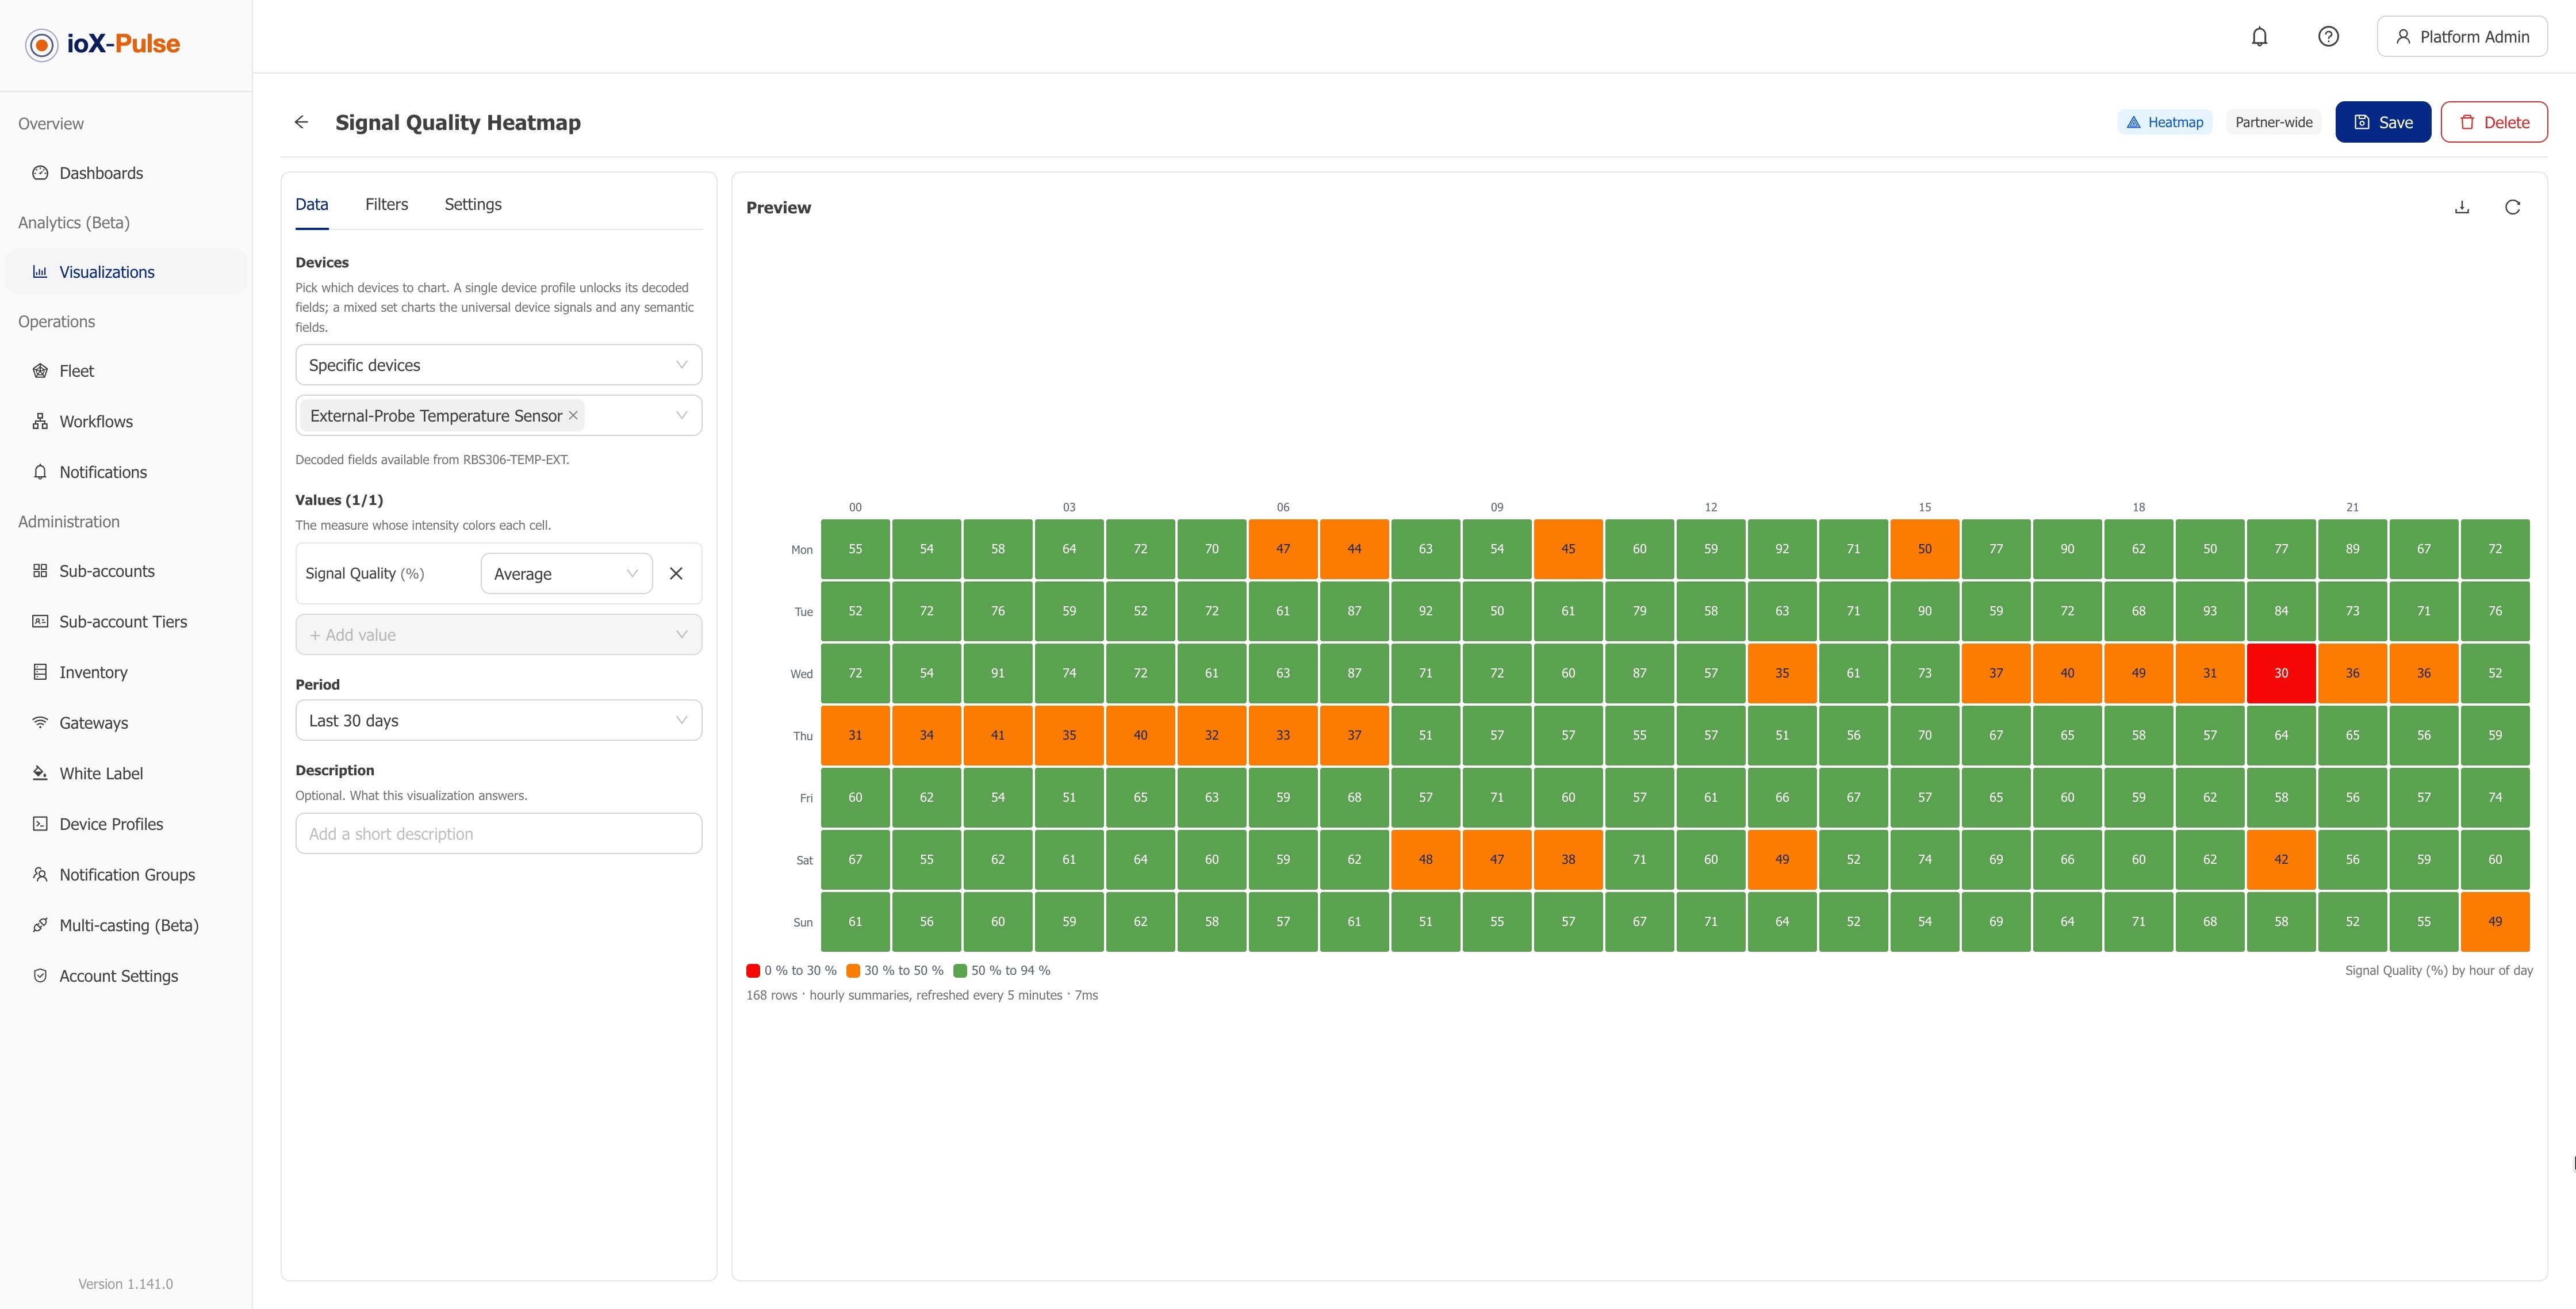
A saved visualization on a dashboard used to show the period its author chose. In 1.141.4, when the author allows it, a calendar button on the tile lets each viewer pick a date range or a relative period for themselves. The plant manager who wants last week and the engineer who wants the last 24 hours share one tile, and neither edits the dashboard.
Grouping got more useful too: any grouped chart can bucket readings by hour of day or day of week in your own time zone. That is the view that shows you a compressor running hot every weekday at 2 PM, and it is what the heatmap chart type is built on.
The data comes with you
Every chart in Analytics and every visualization tile now carries a download icon that hands you the rows on screen as CSV, with a Time (UTC) column and the same moment in your own time zone. If a report, an auditor or a spreadsheet model needs the numbers behind the picture, they are one click away, and authors can turn the download off per visualization where that matters.
The same goes for your integrations: webhook readings and the API's latest values now carry a derived block beside the raw data, with the reading's computed and calibrated values. Whatever consumes your data downstream sees the same numbers your dashboards show.
Value tiles that answer the follow-up question
A Value widget used to show a number. Now it can also show how long a field has met a rule or how long a device has been online, when a rule last matched, and a small trend line or bar chart under the number. "Freezer door open" is useful; "freezer door open for 40 minutes, last opened 6:10 AM, trending worse this week" is a decision.
Countdowns that alert on silent devices
Formula fields can compute values like days until the next service. The catch was that a formula only recomputes when a reading arrives, so a countdown on a device that rarely reports could sail past zero in silence. The new Recalculate fields workflow trigger, a plan feature, writes one reading a day at a time you choose, so the countdown keeps counting and your alert fires whether or not the device spoke that day.
Smaller changes worth knowing
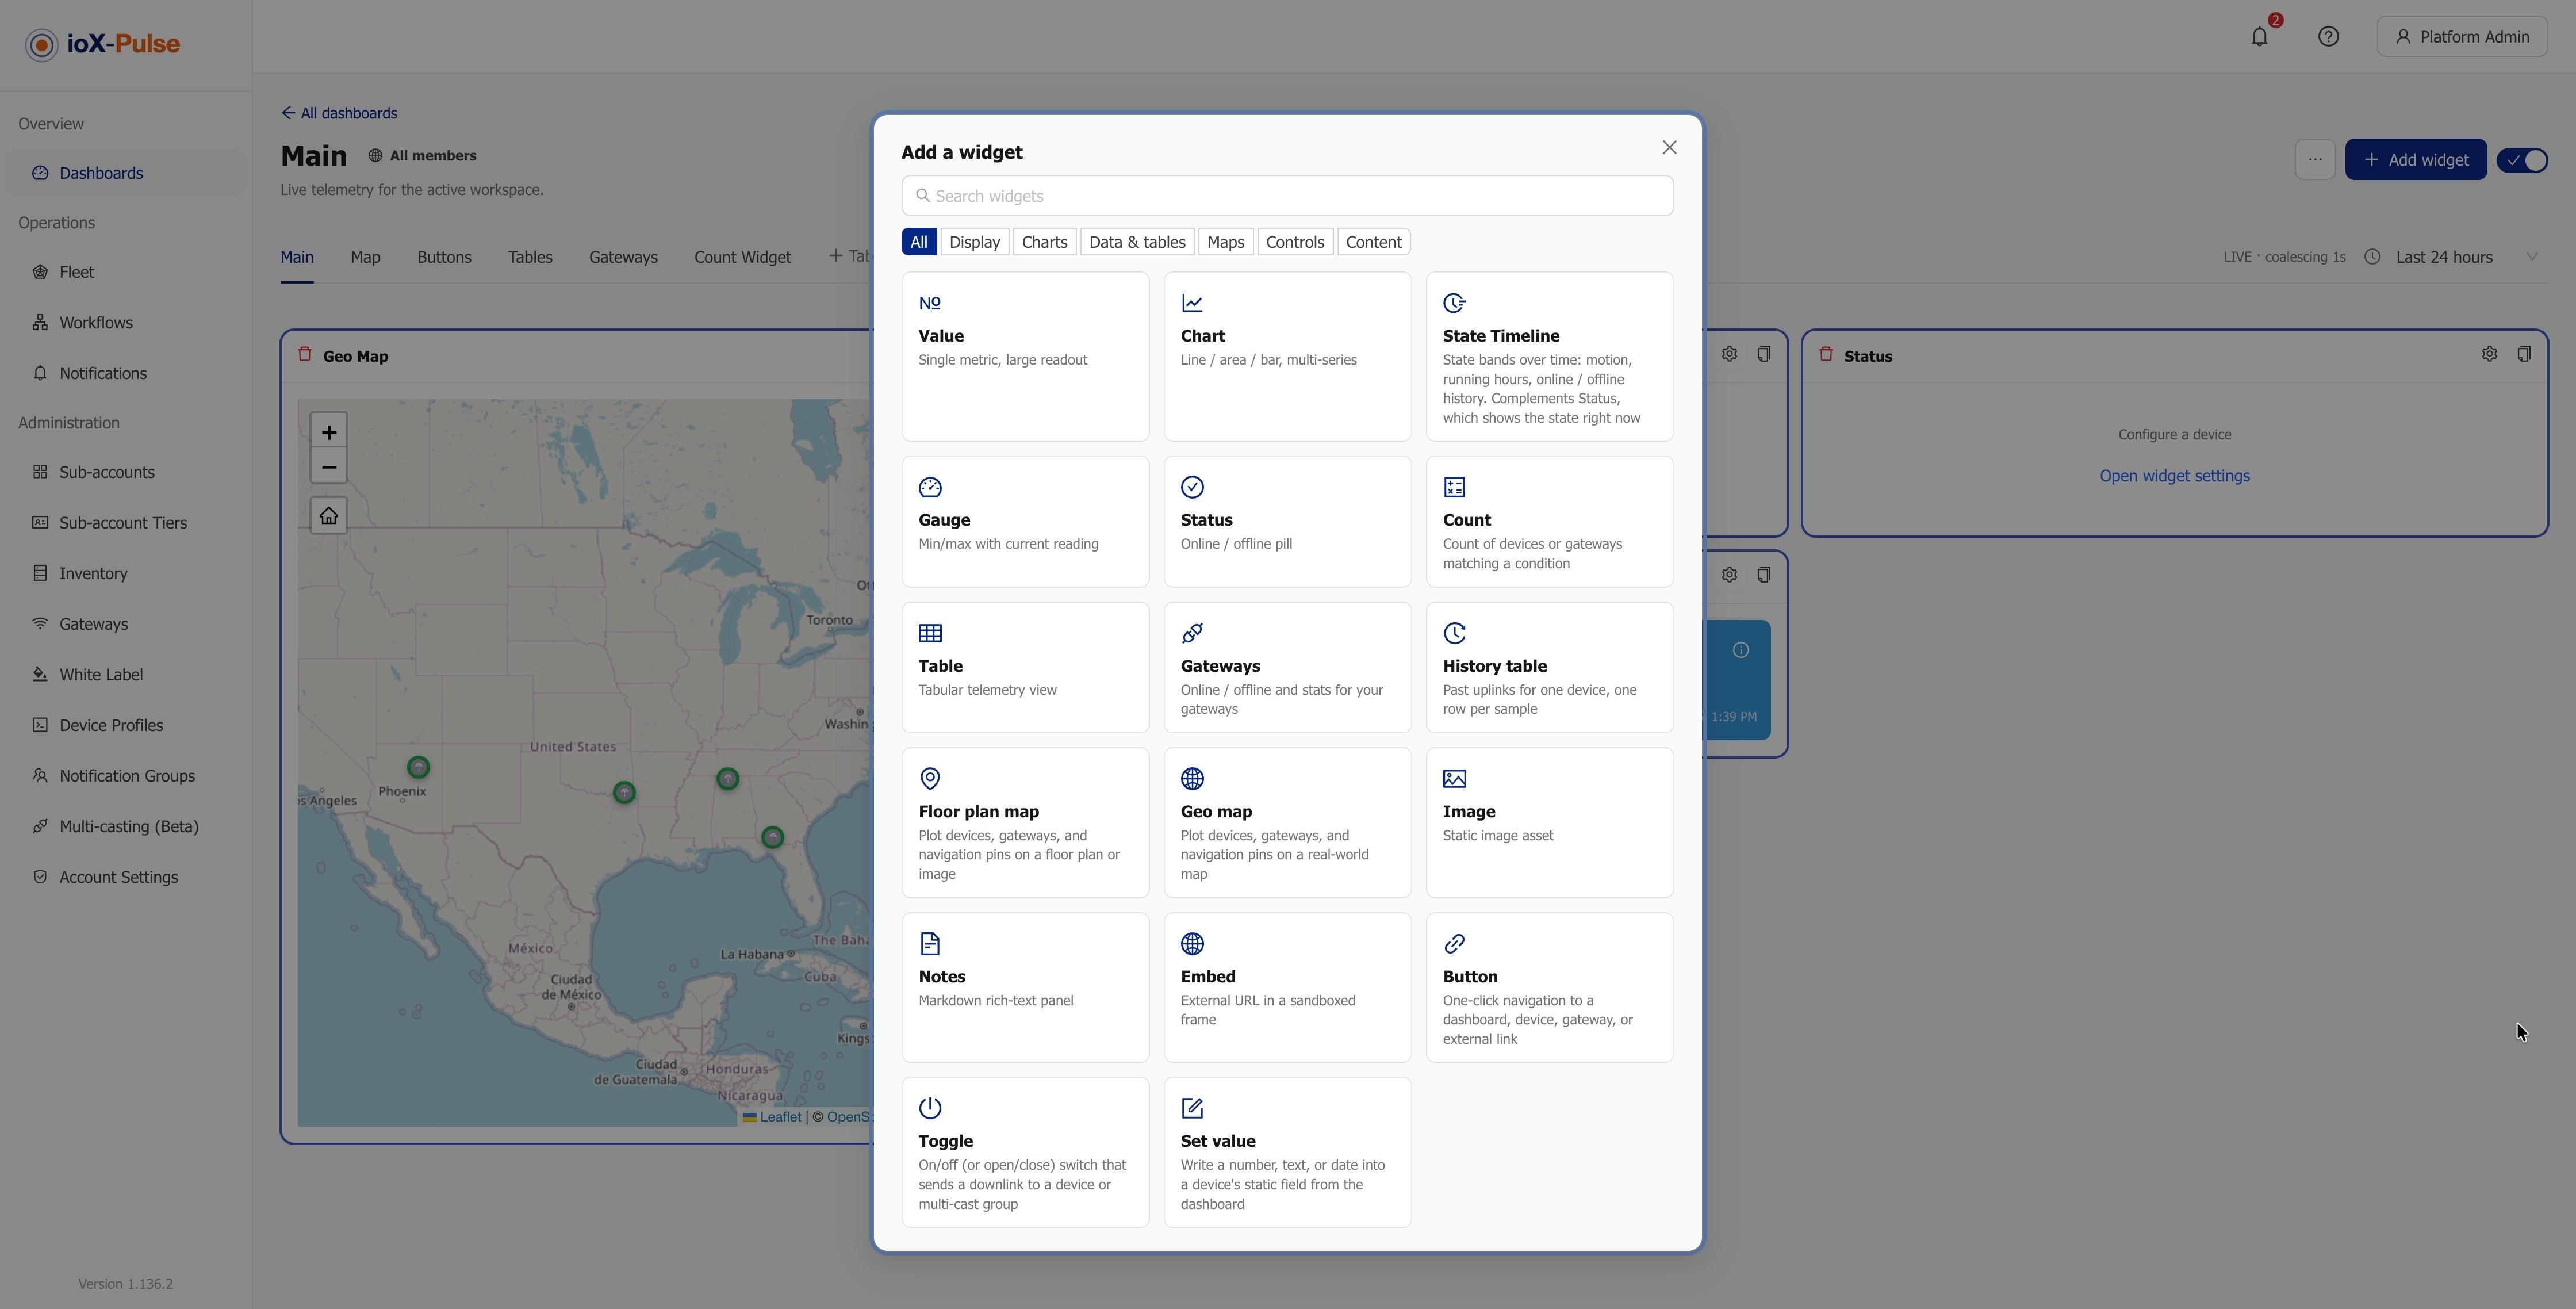
The Geo map widget now adds located devices and gateways from your fleet in one step, and pins follow each record's saved location. Charts hold up to 100,000 rows and draw dense lines from a sample that keeps every peak and dip, while the download keeps every row. A step-by-step recipe posts workflow alerts into a Microsoft Teams channel through the Webhook action, with no coding. And moving hardware back to inventory now clears all of its data, so the next customer starts clean.
Pro Tip: set semantic fields on your busiest profiles first. Analytics, Count widgets and workflows all start reading across profiles the moment the field is marked, so the highest-traffic signals pay back the two minutes of setup immediately.
Why it matters: monitoring tells you what is happening; the September releases are about what your history is worth. The same readings you collected for alerts now answer capacity, energy and maintenance questions, and they do it for the people watching the dashboard, not just the person who built it.
Frequently asked questions
What is in the ioX-Pulse 1.141.4 release?
1.141.4 completes the September Analytics wave in ioX-Pulse: semantic fields that let charts and workflows read a common signal from every device profile, viewer-selectable date ranges on visualization tiles, CSV downloads of the rows behind any chart, duration-in-state and trend displays on Value tiles, fleet pins on the Geo map widget, and a workflow trigger that keeps formula countdowns alerting on devices that never report.
What are semantic fields in ioX-Pulse?
A semantic field marks one field per device profile as a common kind of reading, such as temperature or humidity. Analytics, the Count widget and workflows can then read that signal from every profile in your fleet, so one chart or one rule covers sensors from different manufacturers without per-profile setup.
Can dashboard viewers change a chart's date range themselves?
Yes. When the author allows it, a calendar button on a visualization tile lets each viewer pick a date range or a relative period for themselves, without editing the dashboard.
Can I download the data behind a chart?
Yes. A download icon in Analytics and on every visualization tile hands you the rows on screen as CSV, with a Time (UTC) column and the same moment in your own time zone. Authors can turn the download off per visualization.
Do I need new hardware to use the 1.141.4 features?
No. 1.141.4 is a platform release. It applies to the LoRaWAN sensors and gateways you already have connected to ioX-Pulse, and to readings you have already collected.
See it on your own data
ioX-Pulse is the IoT monitoring platform from the ioX-Connect suite. If you already run LoRaWAN sensors, you can see ioX-Pulse plans and start on your own readings, or talk to an IoT specialist about what your fleet would look like in it. The complete release history is in the changelog.
Topics from this blog: real-time IoT dashboard wireless sensor analytics lorawan ioX-Pulse