Build Dynamic IoT Dashboards That Visualize What Matters Most
The ioX-Connect Dashboards & Widgets module allows users to create fully customizable, real-time visualization environments for any IoT deployment. From facility floor plans to sensor health summaries, users can choose from a wide range of widgets — charts, maps, gauges, alarms, and summaries — to design dashboards that fit their operational needs. Every dashboard is configurable by site or network, ensuring teams have clear visibility into performance, energy consumption, and system status across all connected devices. Whether it’s a single building or a global enterprise, ioX-Connect turns data into an interactive visual experience that drives faster, smarter decision-making.
Powerful Tools to Visualize, Monitor, and Manage IoT Data
ioX-Connect’s dashboard engine gives users complete creative and analytical control. Build interactive data boards, mix visualization types, and link live data streams from sensors, gateways, or external systems. With multi-tab layouts, drag-and-drop configuration, and embedded analytics, ioX-Connect enables teams to monitor performance, detect anomalies, and visualize sensor behavior — all from a unified interface that’s as flexible as it is powerful.
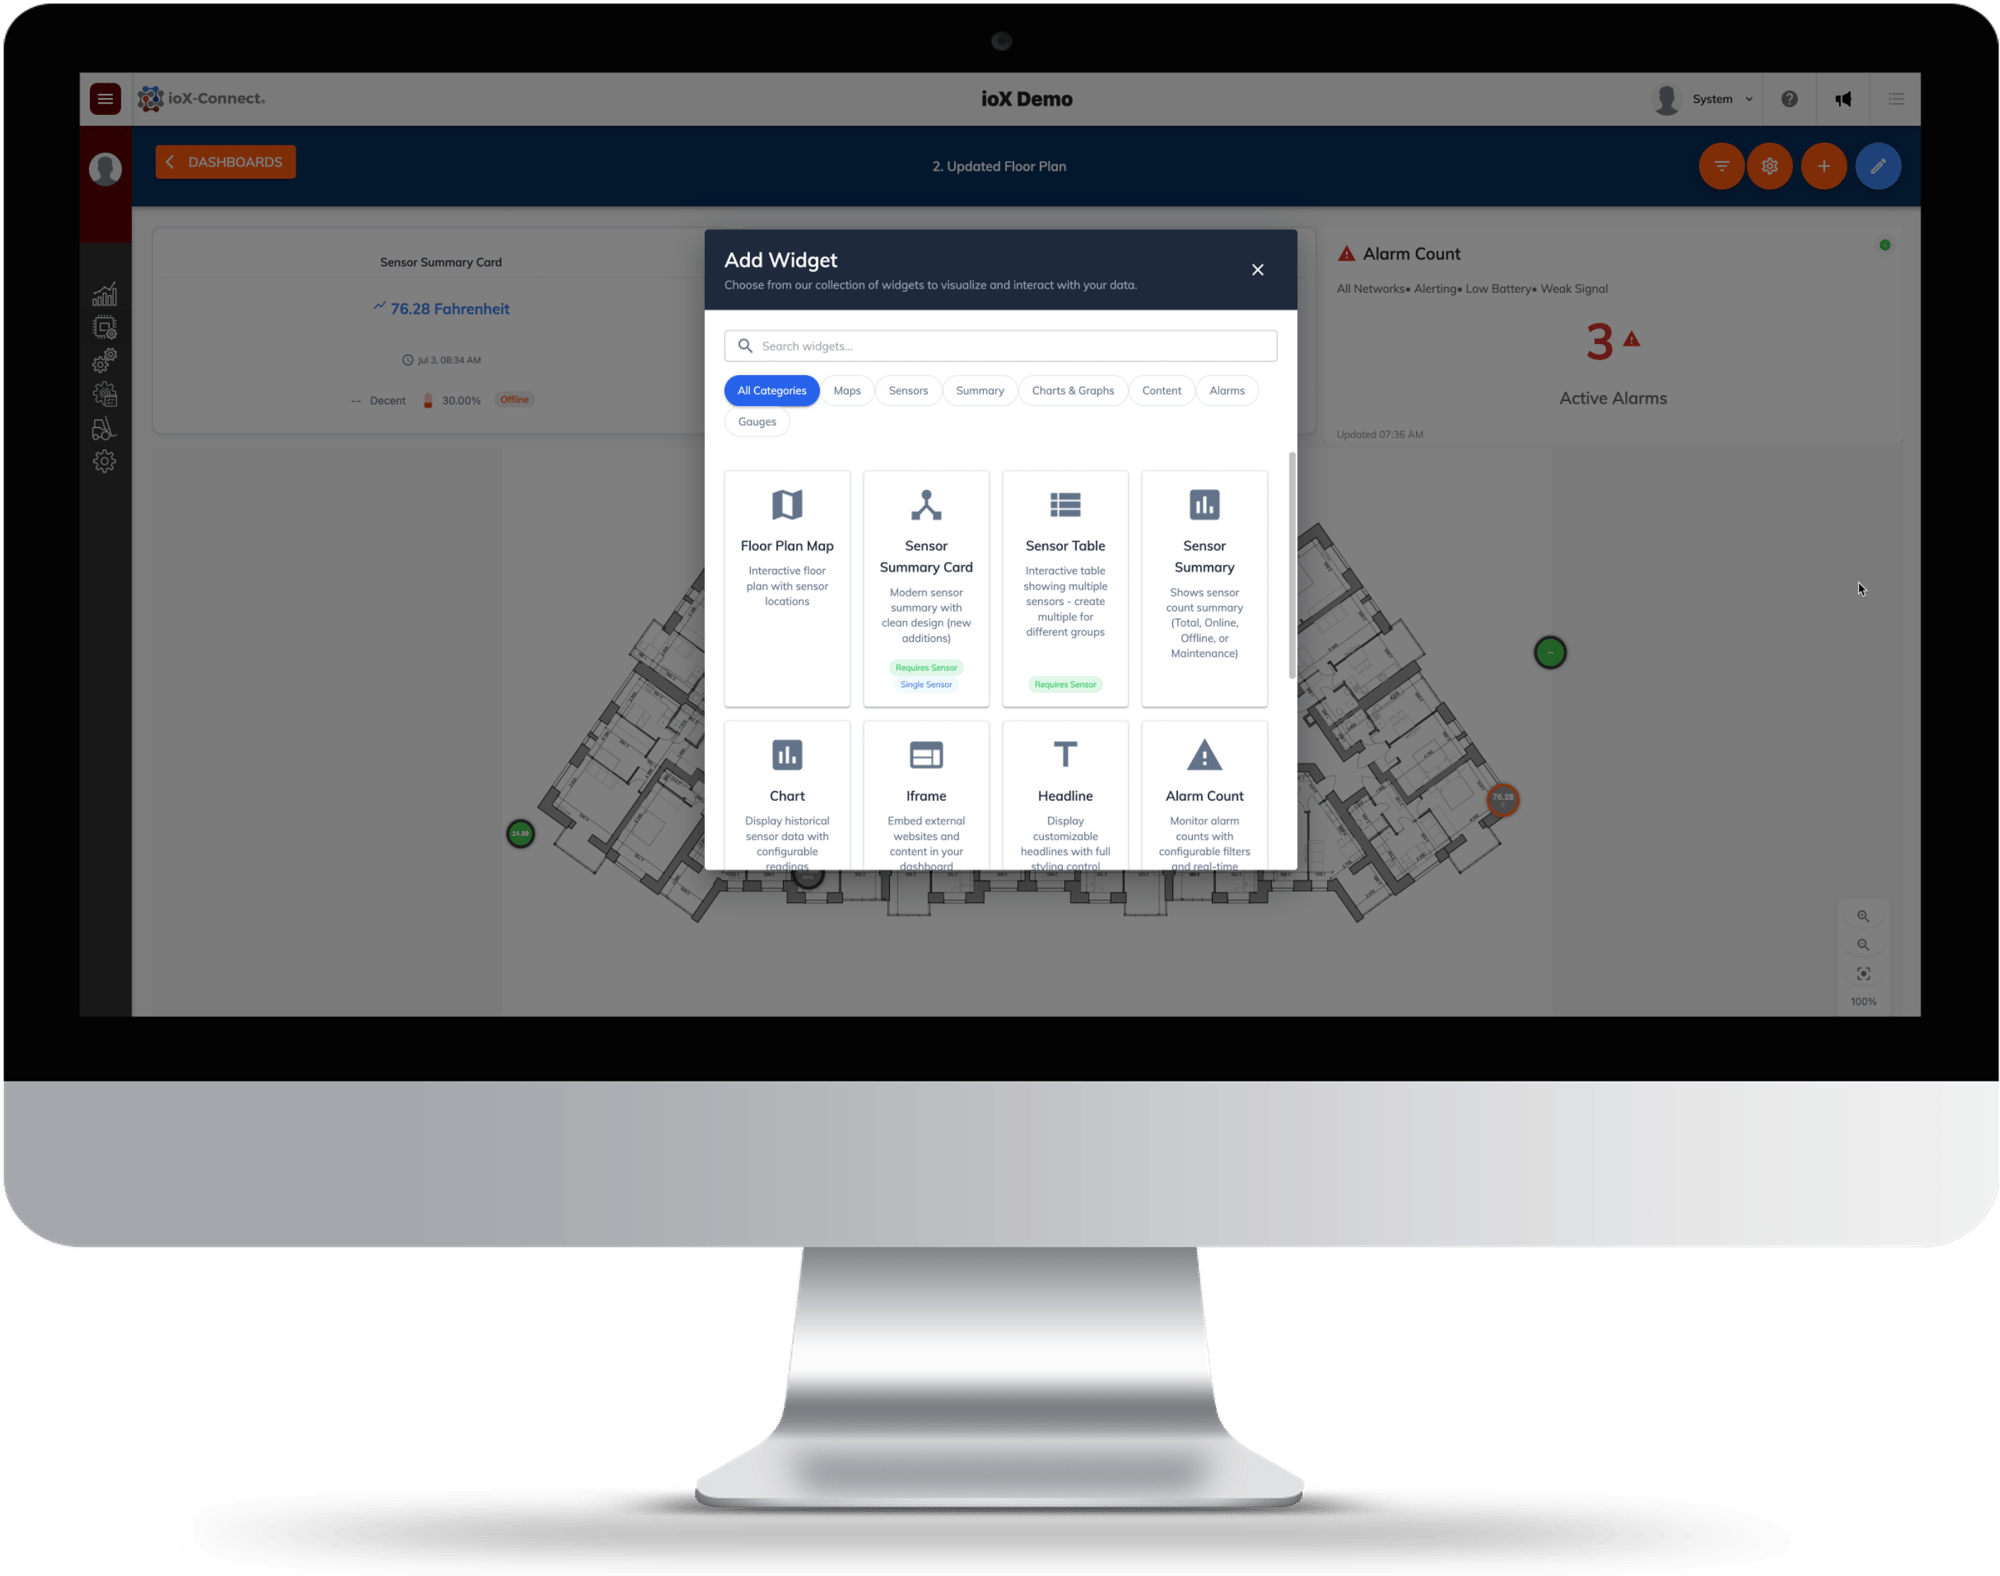
Quickly create personalized dashboards with charts, maps, and data cards using an intuitive visual editor.

Choose from gauges, charts, summary cards, floor plans, alarm counters, and more — all configurable to your needs.

Group dashboards by site, network, or data type. Monitor multiple facilities in parallel without clutter.

See sensor data and alarm states update live, ensuring you’re always working with the most current information.

Securely embed dashboards into other systems or share them across teams with full control over permissions and visibility.

Click into widgets to explore deeper — from summary views to individual device details — for actionable insight in seconds.


Trusted by customers across multiple industries