
Powerful Analytical Cababilities
Gain deep Actionable Insights into your data like never before
Discover hidden insights into your machine, maintenance and production data like never before by blending operational and maintenance data from diverse data sources into a SINGLE powerful reporting dashboard and data query platform.
Visualize your maintenance, production and machine data like never before. The ioX-Connect Analytics portal is our visually enabled data query, analytical and reporting platform that gives you insights into operational performance.
ioX-Analytics
Helping business gain greater insights into their operations
Through the integration of sensor data with other information sources, ioX-Connect has the capability to produce comprehensive and multifaceted reports that offer businesses invaluable insights into the state of their assets and facilities.
-

Environmental Monitoring Dashboard
-
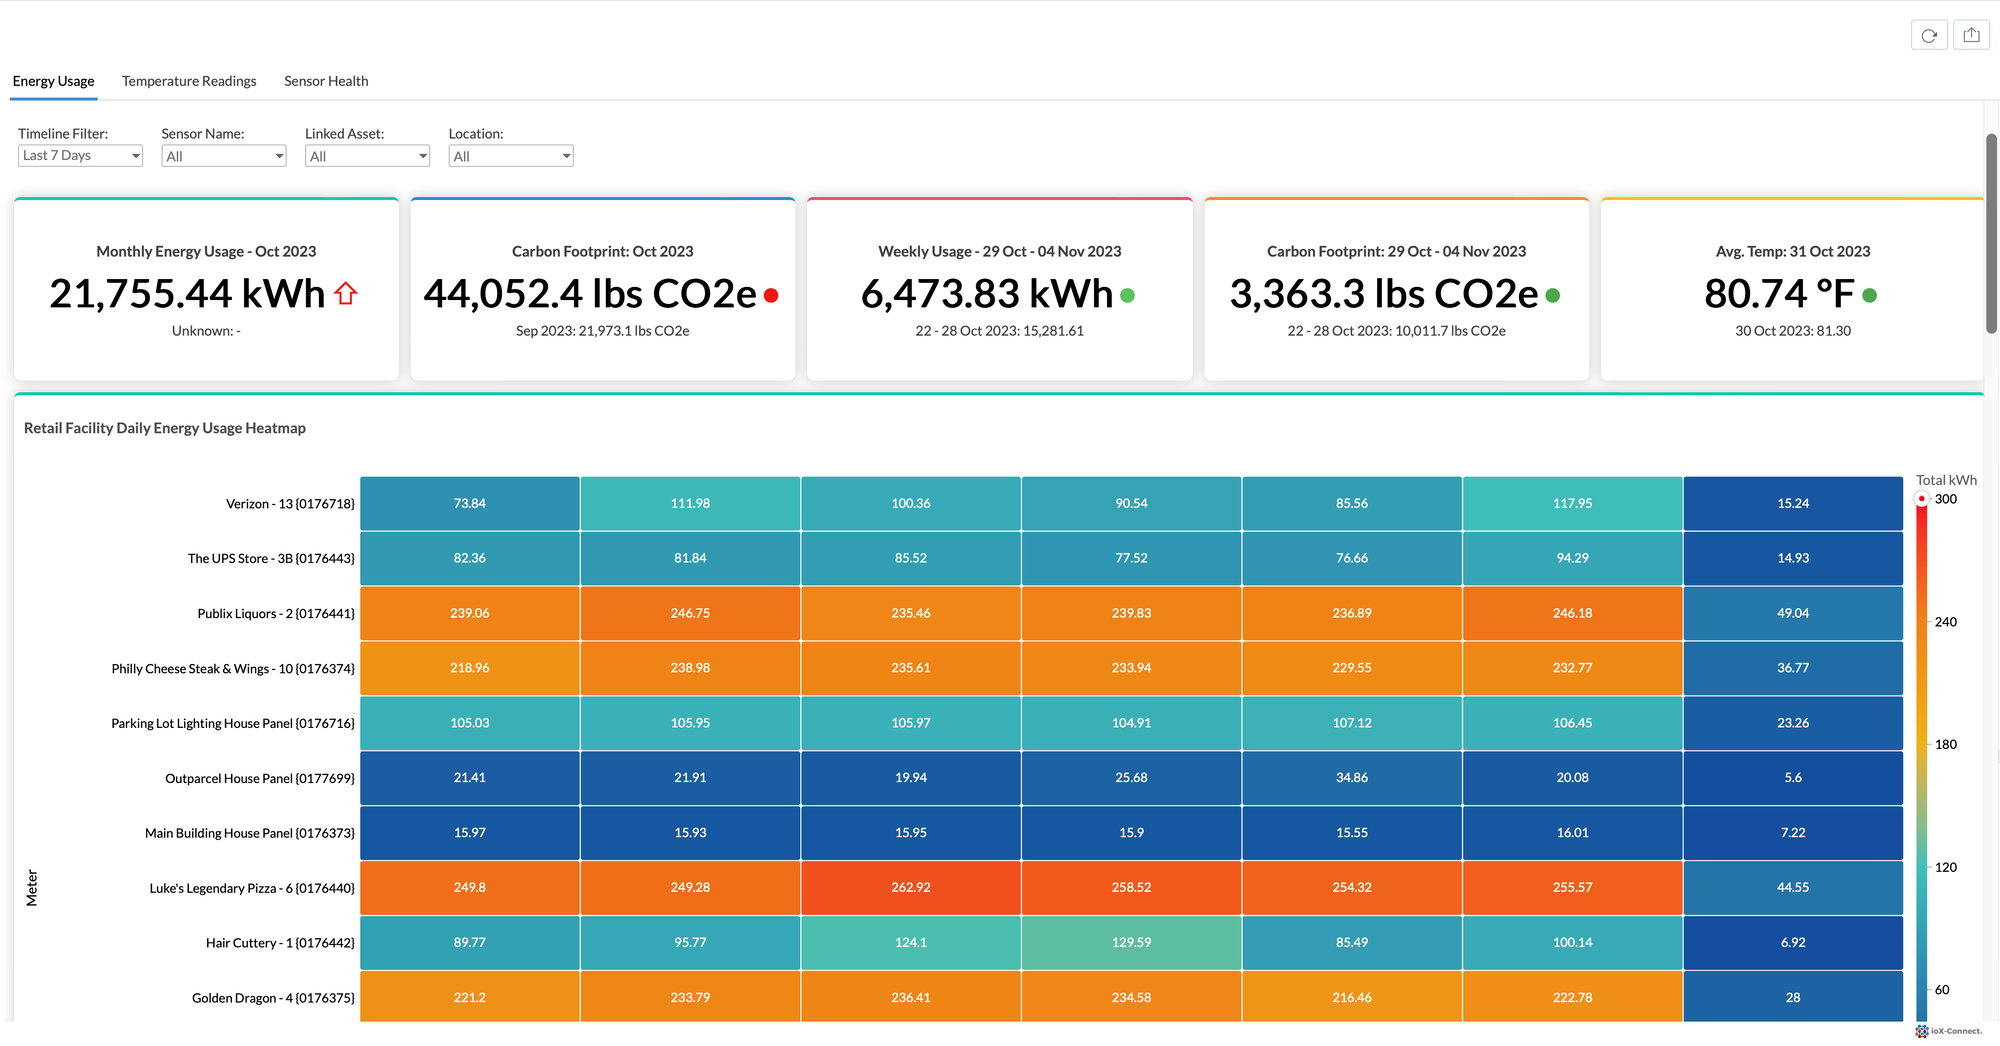
Energy Monitoring Dashboard
-
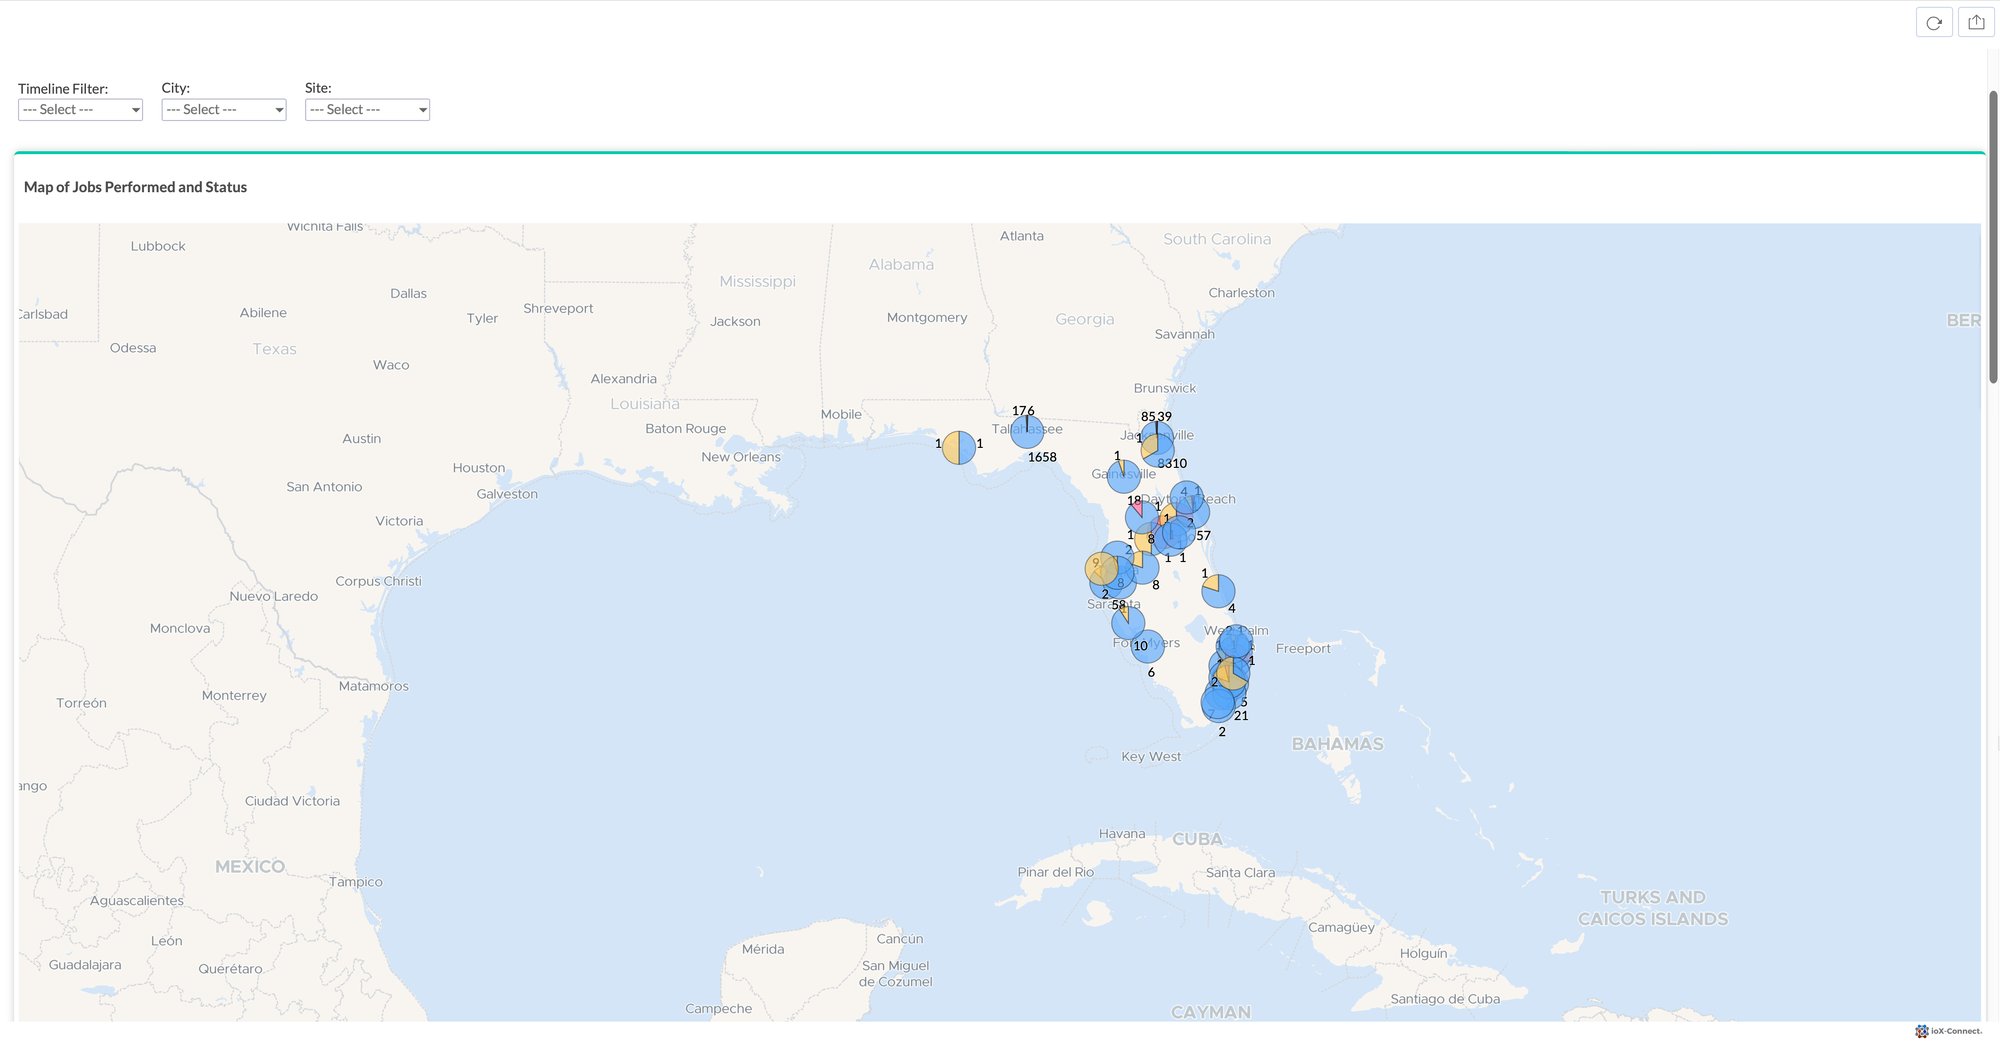
Service Desk Dashboard
-
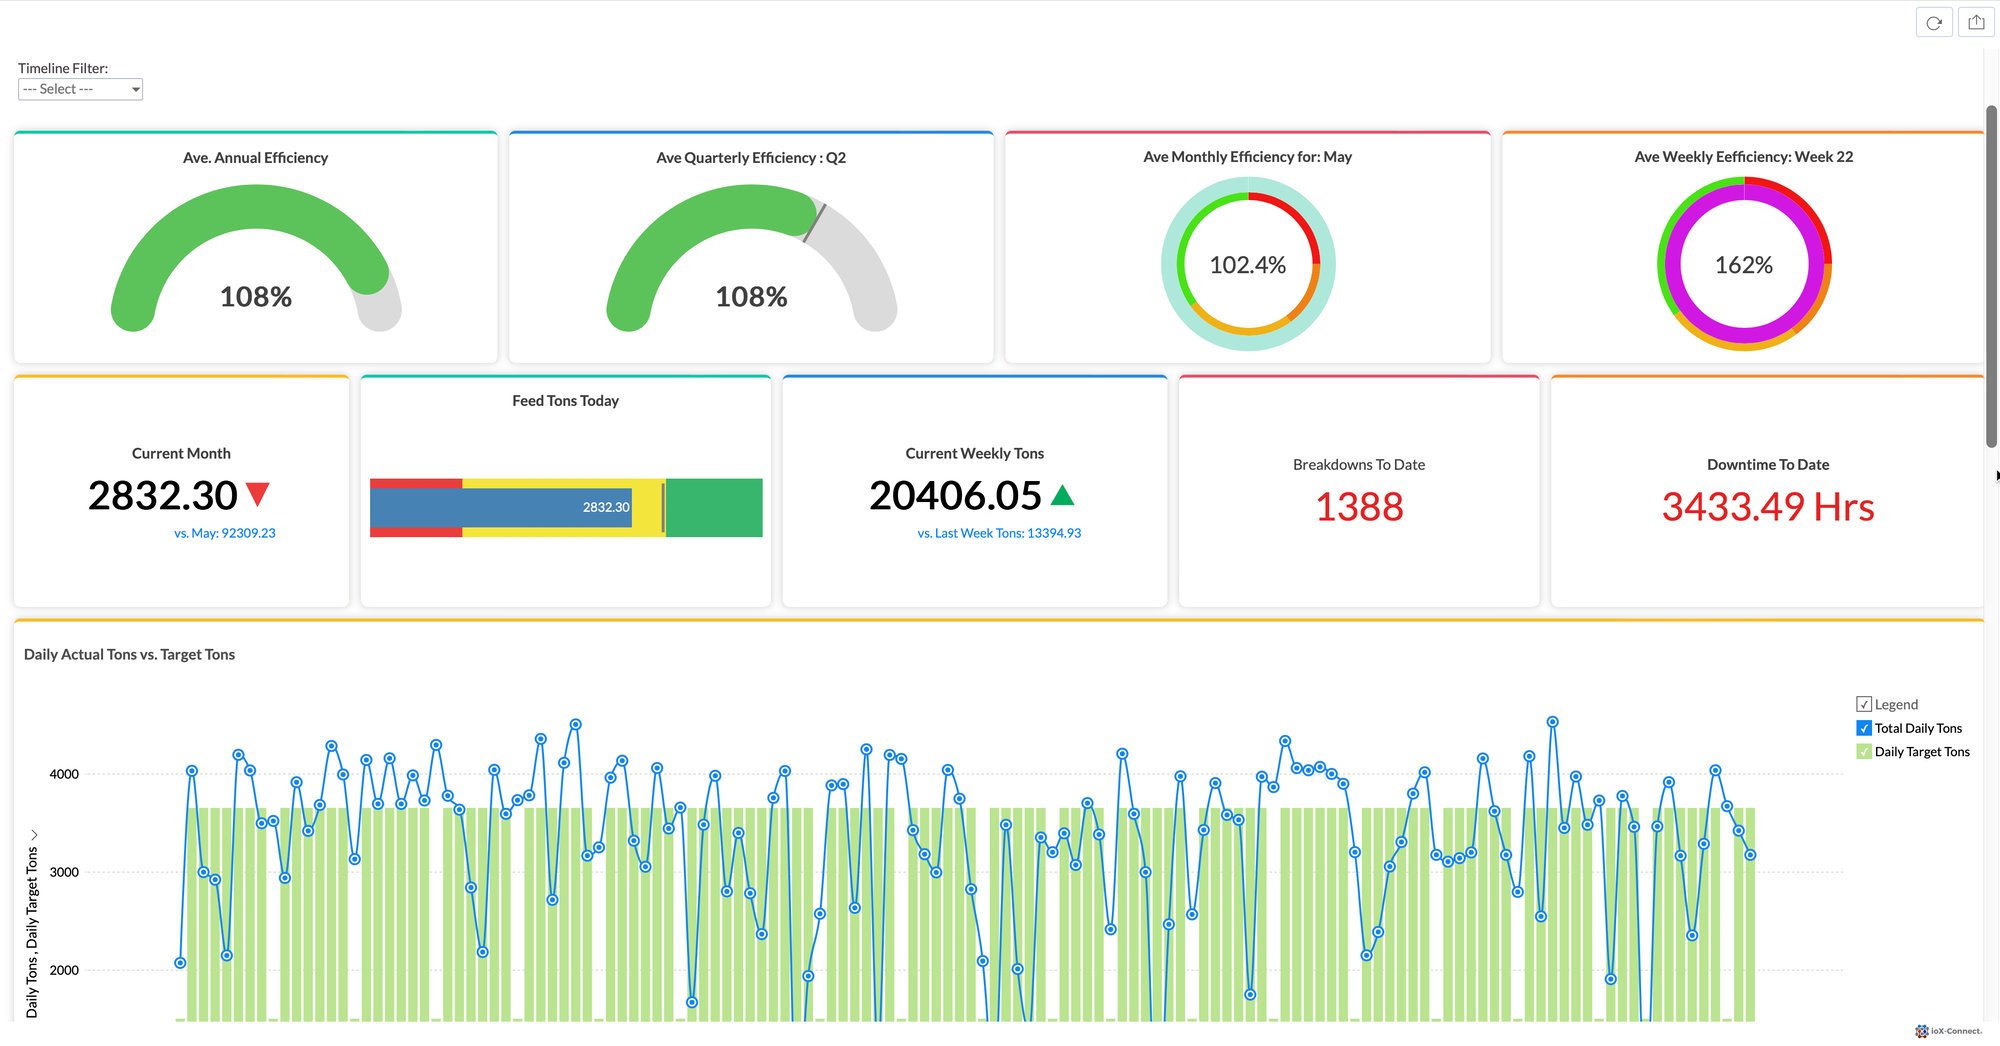
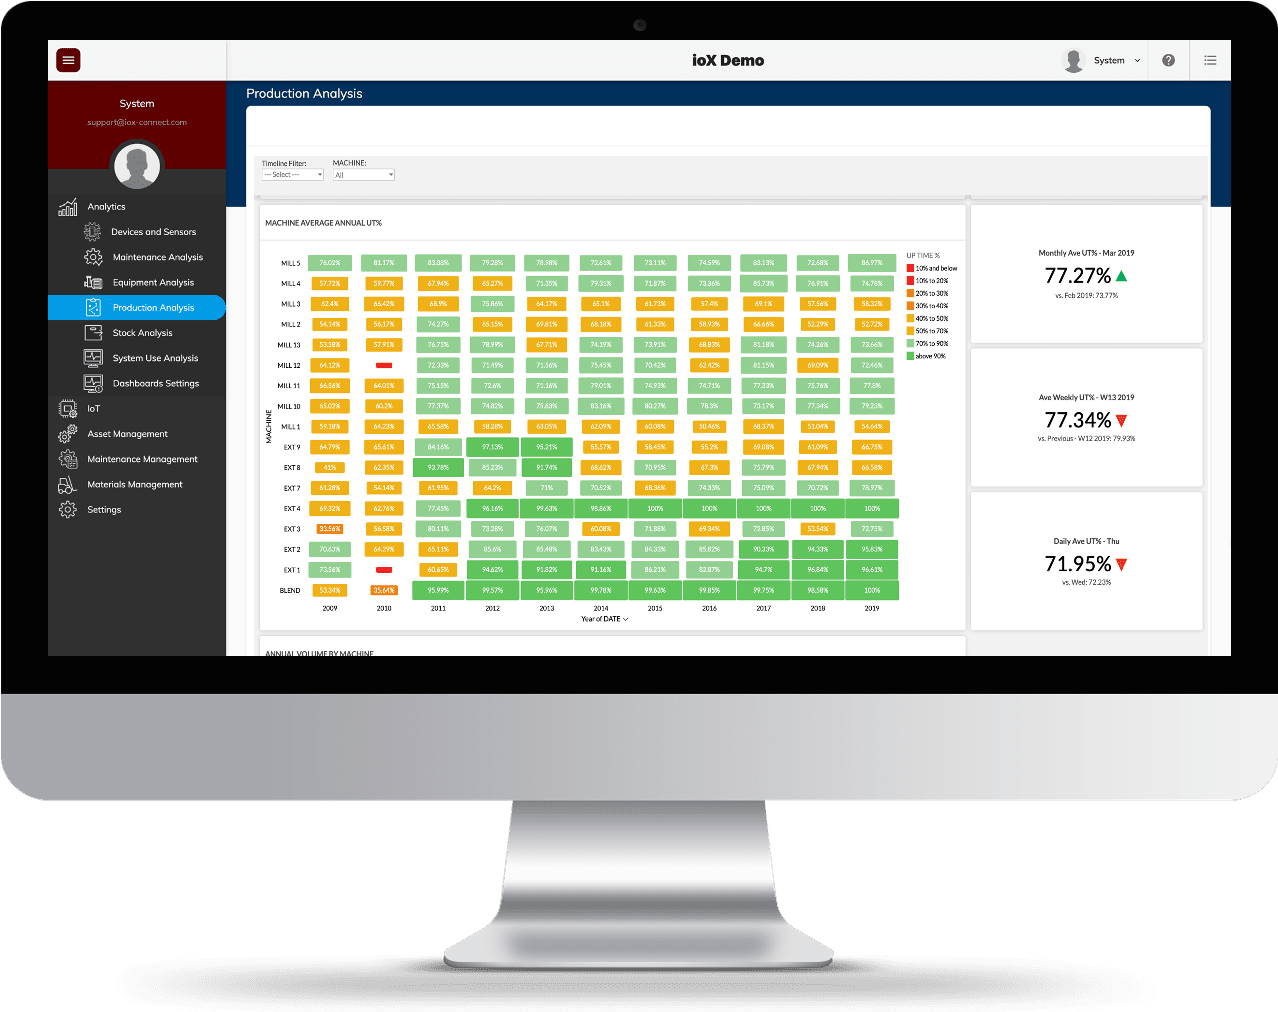
Plant Production Dashboard
-
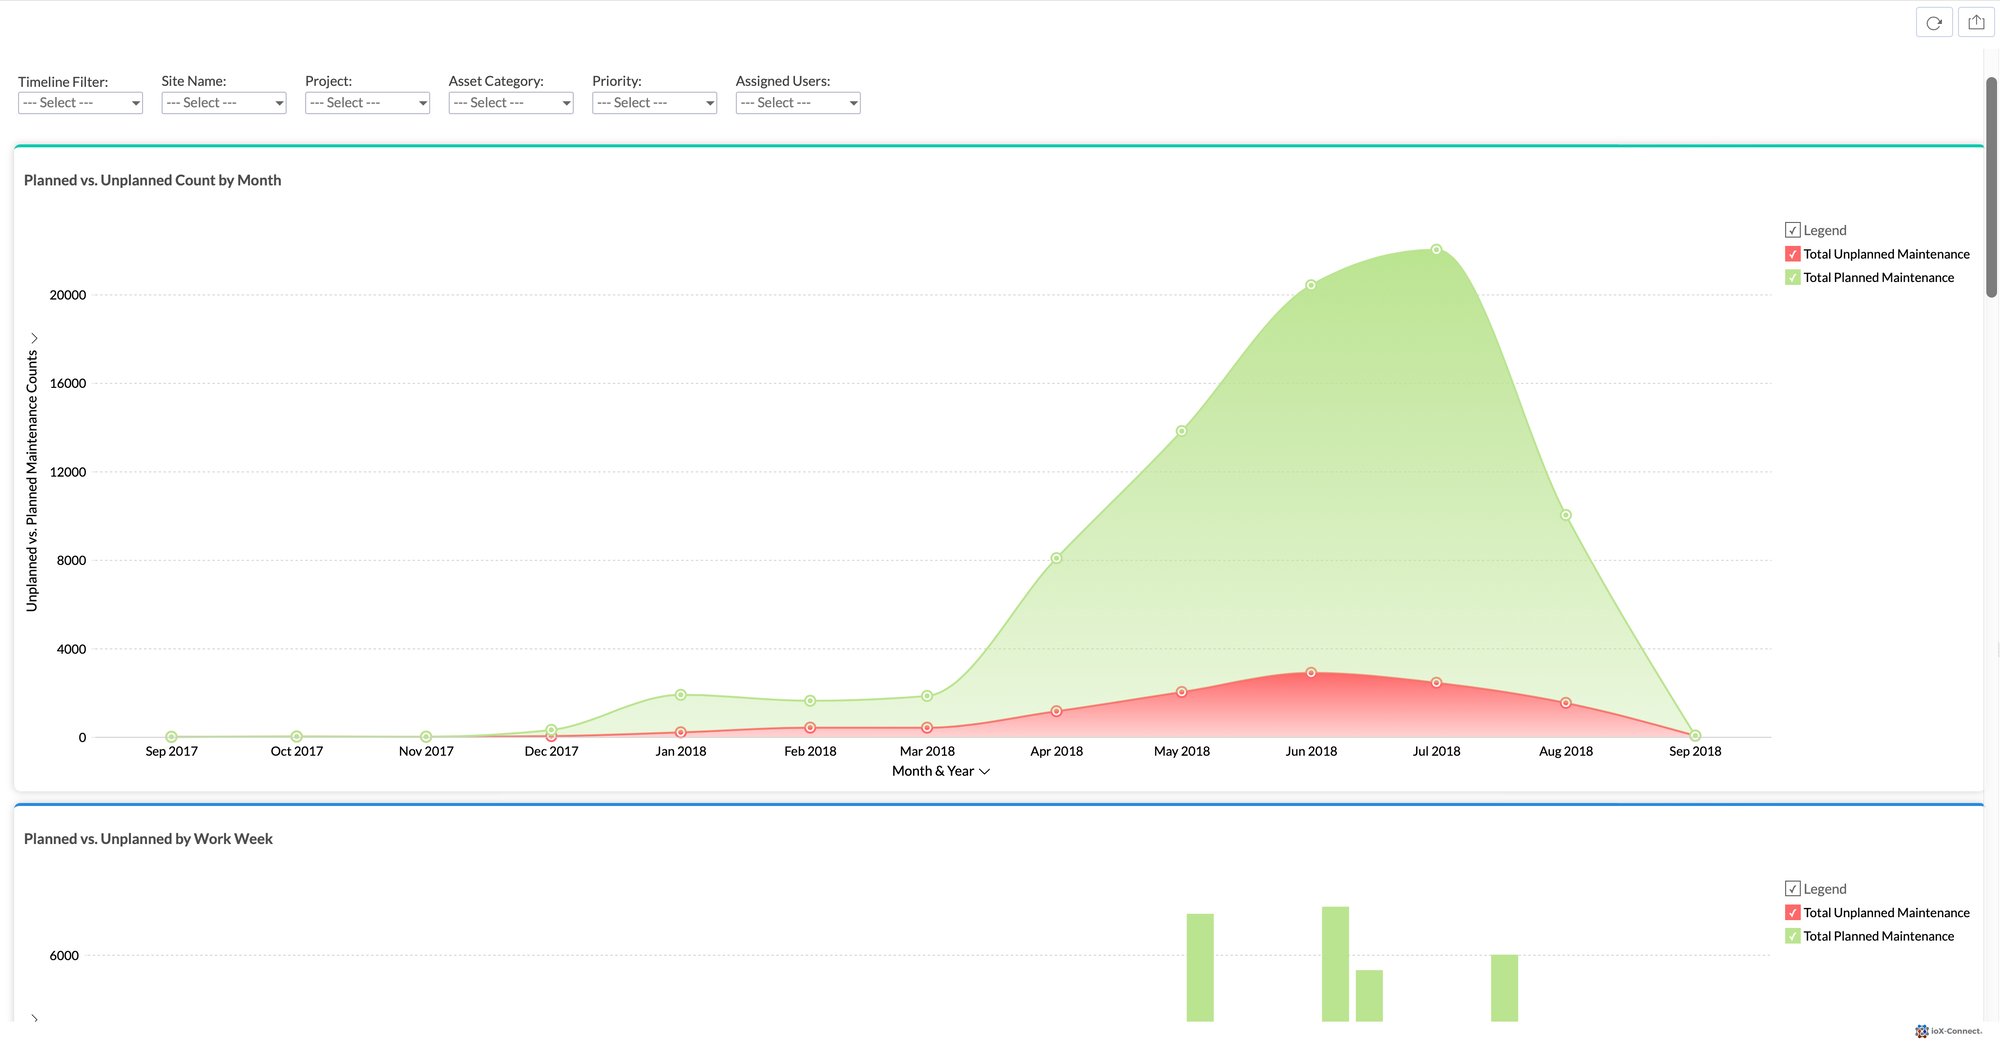
Closed Work Orders Dashboard
-
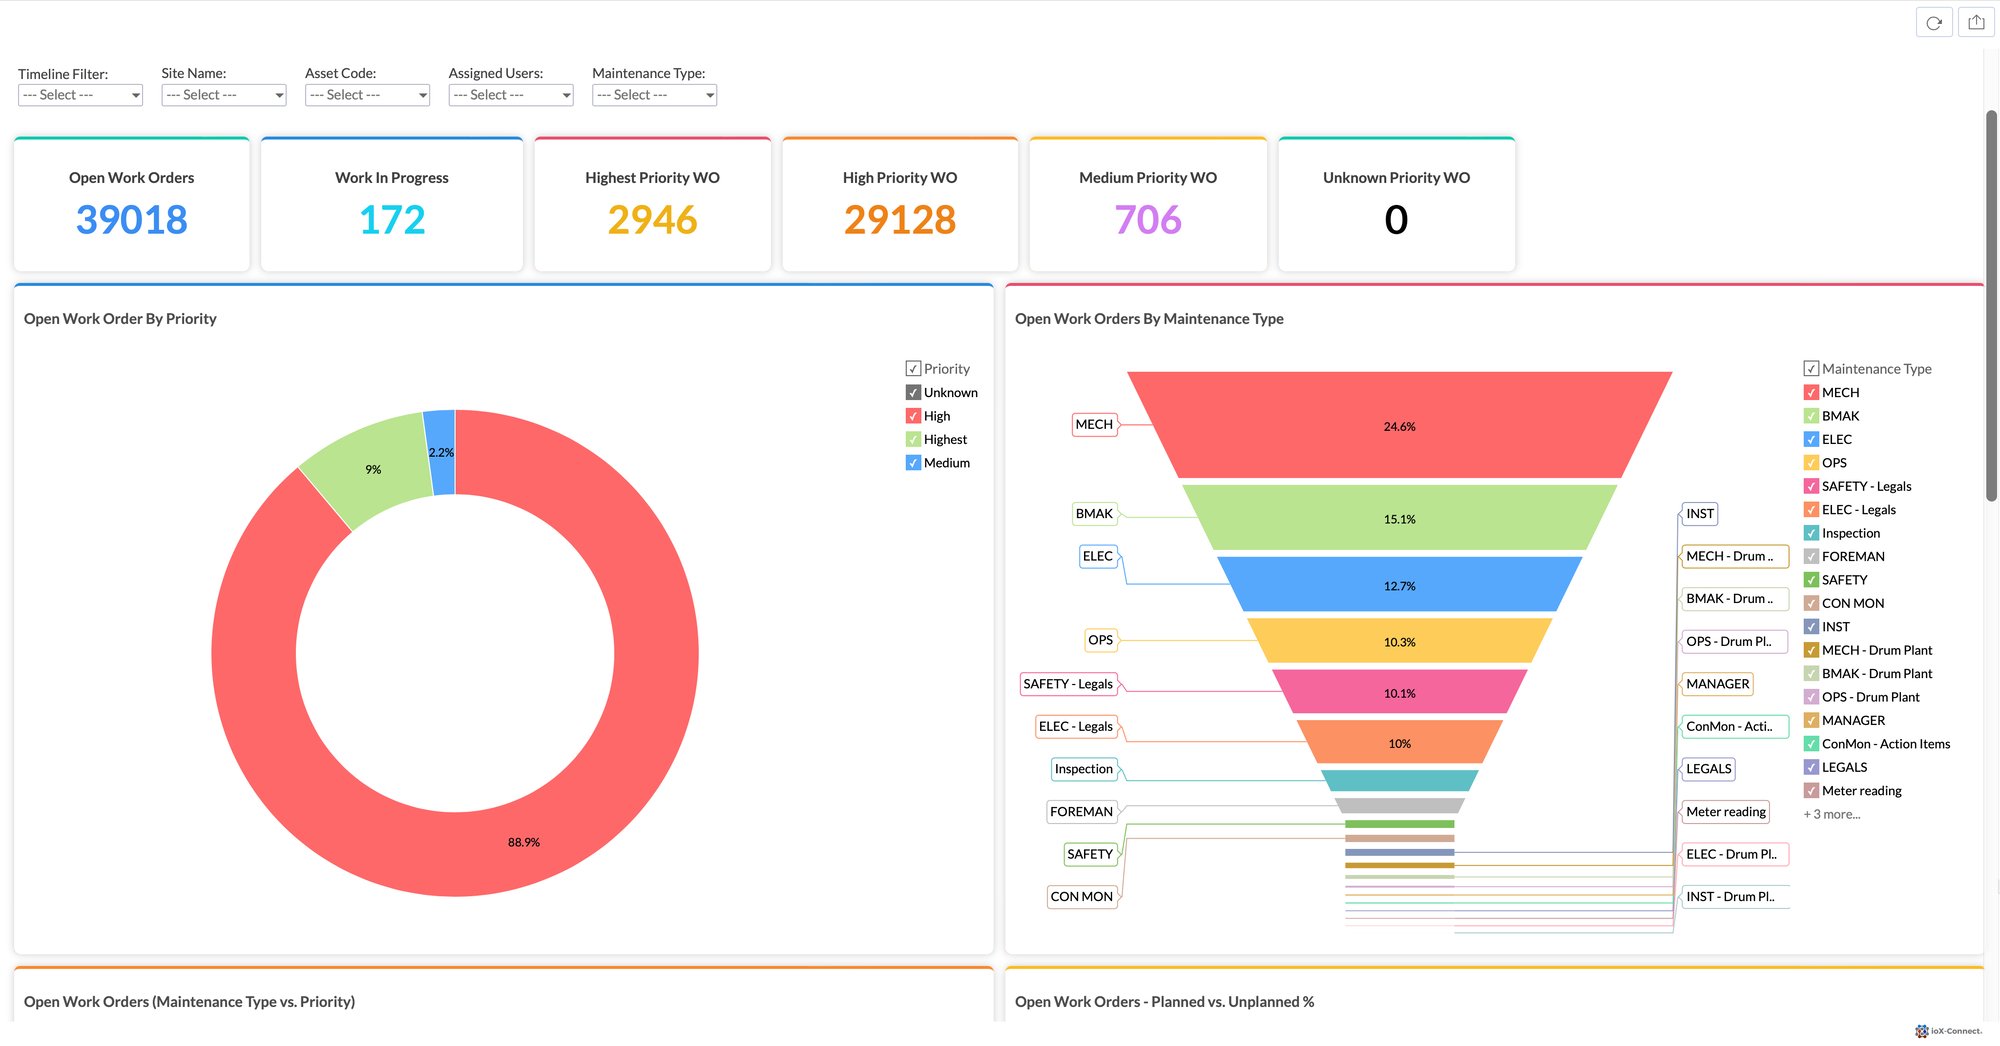
Open Work Orders Dashboard
-
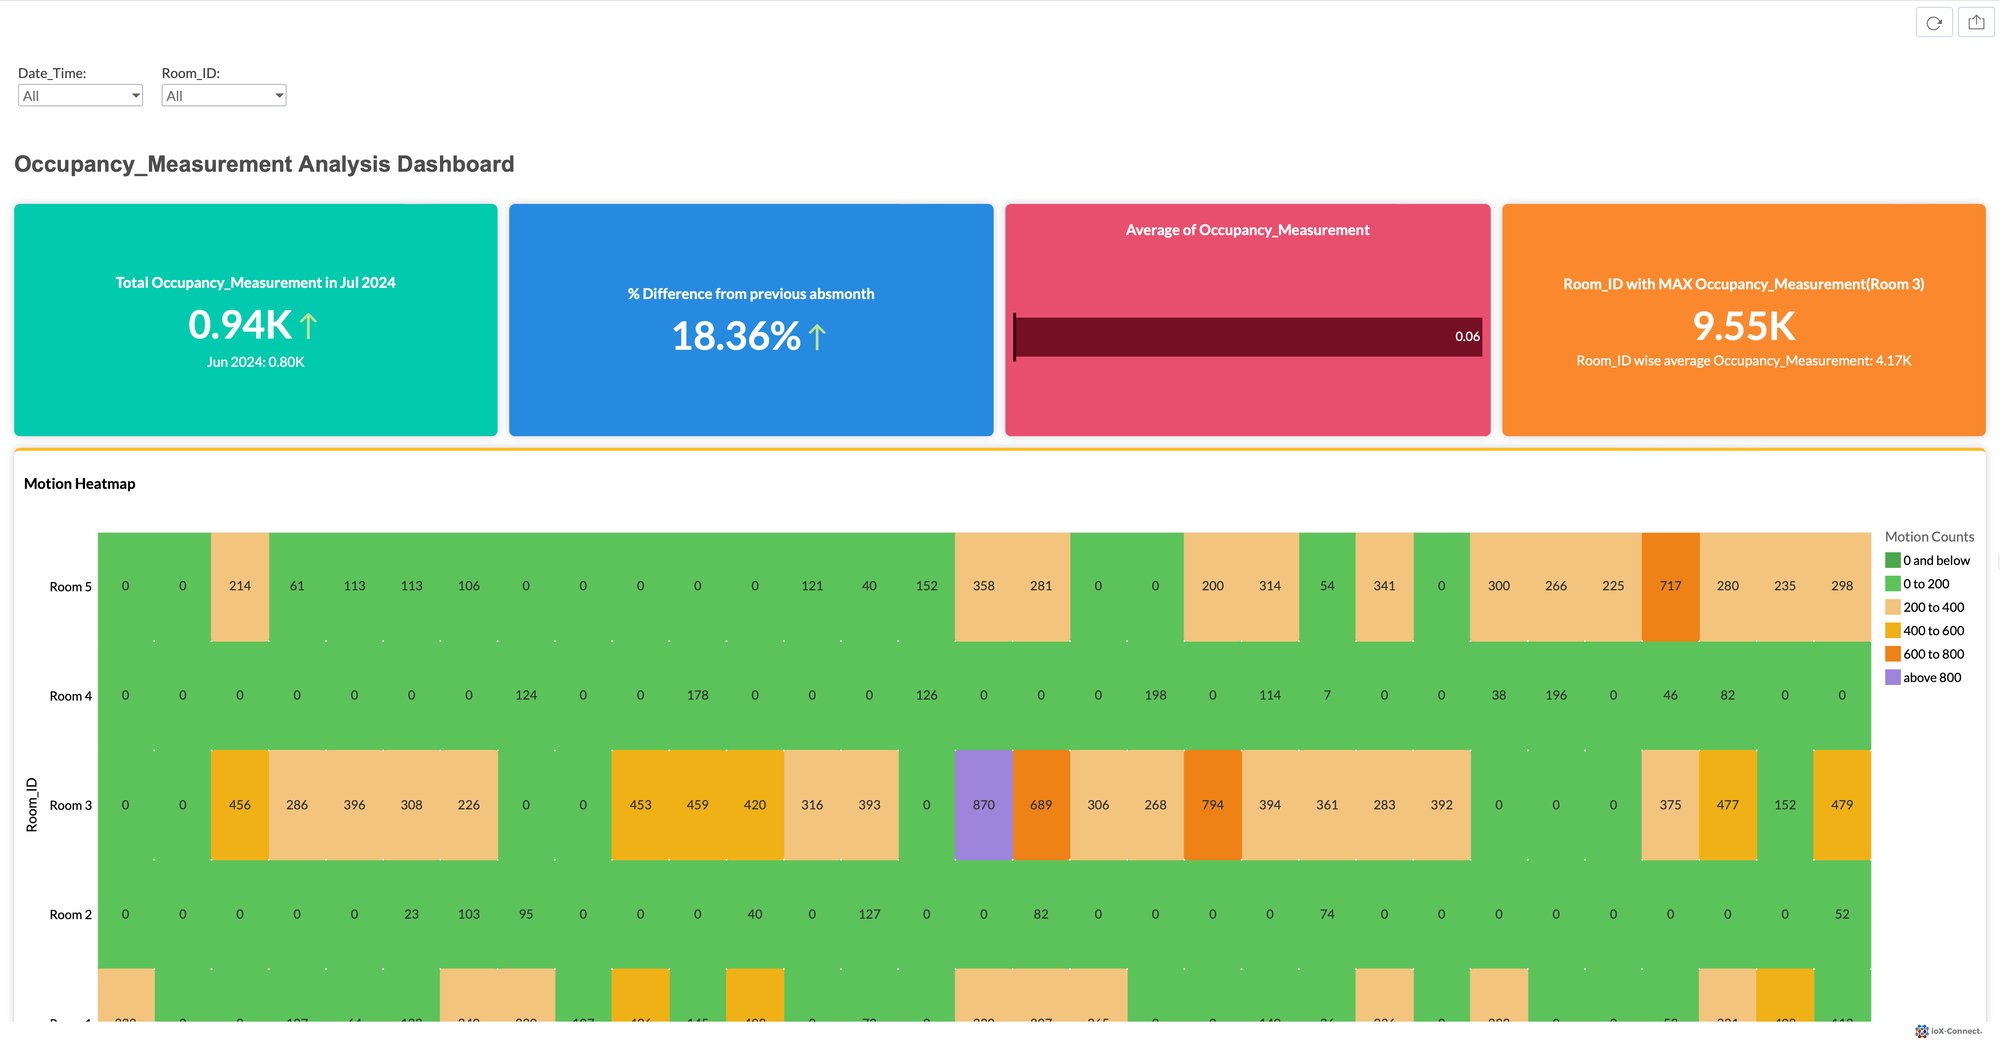
Occupancy Monitoring Dashboard
-

Pump Jack Stroke Count
-

Vibration Monitoring
-

Warehouse Dashboard
No Results


