
ioX-Connect Change Log
This page highlights the latest updates to the ioX-Connect platform, including new features, bug fixes, and enhancements. Our team is dedicated to continuously improving your experience. Here, you’ll find regular posts about recent changes, along with updates from the past two years as we complete our records. Thank you for your ongoing partnership.
Looking for a specific feature, please let us know by filling out our new Feature Request Form.
Developer's Note: This release adds conditional triggers to sensor workflows — you can now attach an optional guard sensor so a workflow's conditions are only evaluated while a second sensor's reading qualifies (for example, only alerting on indoor temperature when an outdoor sensor is above a threshold), with a configurable hysteresis buffer, a staleness window, and fail-open/suppress handling when the guard reading is stale. Alongside this we made several workflow builder improvements and fixes: workflows now prompt for a name up front, the network lookup shows a device count per network, the guard sensor picker is filtered to the workflow's network, the same sensor can no longer be added to monitored items more than once, and we resolved a blank screen that could briefly appear on the Workflows page right after a deployment (it now recovers automatically). If you run into any issues post deployment, contact us at support@iox-connect.com so we can take a look.
New
Guard sensors (conditional alerts). Sensor workflows can now be gated on a second sensor — conditions are only evaluated while the guard sensor's reading meets a condition you set (e.g. only alert on indoor temperature when an outdoor sensor reads above a threshold). Includes a configurable hysteresis buffer to prevent boundary flapping, a staleness window, and a choice of whether to keep alerting or suppress when the guard sensor's data is stale.
Improvements
- Creating a workflow now prompts for a name up front and carries it into the builder.
- The network selection dialog now shows a device count for each network.
- The guard sensor picker is limited to sensors in the workflow's selected network.
Bug Fixes
- Prevented adding the same sensor to a workflow's monitored items more than once.
- Fixed a blank screen that could appear on the Workflows page immediately after a new release; the app now recovers automatically.
Developer's Note: A focused patch addressing two issues on the work order module: work orders now correctly respect site access - users only see work orders for the sites they're linked to, unassigned work orders, and work orders where they're the responsible person - and we've fixed a crash that occurred when clearing a date or time field (such as Estimated Job Duration). If you run into any issues post deployment, contact us at support@iox-connect.com so we can take a look.
Bug Fixes
- Fixed: Work order site filtering - users now only see work orders for their linked sites, unassigned work orders, and work orders where they are the responsible person (applies to list, card, and calendar views). Previously all work orders were visible to everyone.
- Fixed: App crash when clearing a date/time field (e.g. Estimated Job Duration). Date/time fields can now be cleared without error across work orders, tasks, labour, meter readings, and maintenance plans.
Developer's Note: A small follow-up patch to the Workflows module with three quality-of-life improvements and one notification fix. If you run into any issues post deployment, contact us at support@iox-connect.com so we can take a look.
Workflow Improvements
Search the Workflows List
The search bar on the Workflows page now filters the grid as you type, so you can jump to the workflow you need without scrolling.
See Every Workflow Linked to a Sensor
Open any sensor and switch to the Workflows tab to view every workflow that sensor is tied to - including older-style workflows that previously didn't appear here. This makes it much easier to track down and fix unexpected notifications.
Rename a Workflow More Easily
The workflow name is now an editable field at the top of the builder, so you no longer need to open the Trigger step to change it.
Bug Fixes
- Fixed an issue where legacy minimum/maximum threshold workflows would still send notifications for a sensor side that had been muted with the Do Not Alarm toggle. Legacy workflows now respect the sensor's alarm settings on both the minimum and maximum side, resolving repeat alerts on sensors that had been intentionally silenced.
Developer's Note: This release adds new per-tenant database columns to tblWorkflowActions (SeasonStart, SeasonEnd, RepeatAnnually) and tblWorkFlowLog (TriggerMessage), plus a one-time data correction for any workflow conditions created during the v1.5.x preview cycle. Idempotent migration scripts must be run against each tenant database before this build is promoted to production. If your deployment account requires a manual SQL block instead of the automatic runner, contact us at support@iox-connect.com and we'll send one over.
New Features
Redesigned Workflow Builder
We've replaced the old modal-and-stepper workflow create/edit screen with a full-page node-flow builder. Your existing workflows load and save without any changes from your side, but you now have a far cleaner canvas for editing - with a top-bar Active/Inactive switch, a Delete button right where you need it, and faster navigation between nodes.

When you save changes, you stay on the page instead of being bounced back to the workflow grid. New workflows redirect straight into edit mode after creation, so you can keep building without losing your place.
Per-Item Conditions
You can now apply per-item conditions on the Monitored Items step of any workflow, giving you finer control over which sensors trigger which actions. Each item in the workflow can carry its own threshold, comparison, and reading type, so a single workflow can monitor a mixed group of sensors with the right rule applied to each one.
Seasonal and Recurring Windows
Each per-item condition can have an optional seasonal or recurring date window. Set a start and end date and decide whether the rule should repeat every year. This is useful for freeze-protection rules in winter, harvest-season monitoring, or any condition that should only evaluate during certain months of the year.

Workflow Activity Drawer
Every workflow now has a built-in Activity drawer showing the last 100 trigger events. You can review which conditions fired, when, and what message was sent, and export the full activity to CSV for offline analysis or audit reporting.

Re-alert Cooldown (renamed from Notification Delay)
The Notification Delay setting has been renamed Re-alert cooldown to make its purpose clearer - it controls the minimum gap between repeat notifications for the same workflow, not how long the first alert is held. We've also replaced the scroll-wheel picker with one-click chips: None, 5m, 15m, 30m, 1h, 4h, 8h, and 24h.

Workflows Grid — Four New Columns
The Workflows grid now shows four new columns to help you spot workflow performance at a glance: Last Triggered, Items, Recipients, and Times Triggered. The Type column is also wider so longer names are easier to scan.
Quick-access Menu
The loudspeaker menu in the top bar now links to live destinations: Hardware, Change Log, and Feature Request.
Enhancements
Native Dropdowns Across the Workflow Builder
Submodule, Workflow type, Trigger on, and Notification type fields are now native dropdowns rather than dialog selectors. They open with a single click, support keyboard navigation, and refresh their options automatically when their parent selection changes.
Safer Workflow Edits
Changing Submodule, Network, or Workflow Type while you already have items selected now prompts you for confirmation, so you don't accidentally wipe out your configuration.
Bug Fixes
- Fixed a long-standing issue where workflows set to Inactive could still send notifications. Inactive workflows are now filtered out before any sensor data is evaluated.
- Fixed an intermittent startup error that caused sporadic database connection failures during app launch.
Developer's Note: This release introduces new per-tenant database columns (IsDeleted on TblMaintenancePlans and TblPlannedTasks) applied automatically on app startup by a built-in migration runner. The runner is idempotent and requires ALTER TABLE permission on tenant databases during the first deployment after the release. If your deployment account requires a manual DDL script instead, please contact EAMS Technologies at support@iox-connect.com. If you experience a problem with this release or the system in general, please reach out to our support team so we can assist you as soon as possible.
New Features
Delete Maintenance Plans and Task Groups
We've added the ability to delete maintenance plans and task groups directly from their edit dialogs. Open the record, switch to edit mode, then click the red trash icon. A confirmation prompt prevents accidental deletion.

Maintenance plans are archived rather than hard-deleted, so any previously generated work orders and work requests retain their full audit trail. The plan's triggers, linked assets, planned tasks, logs, and attachments are removed, and the plan itself disappears from lists, pickers, and the trigger scheduler.
Task groups are fully deleted, along with their tasks, labors, parts, subtasks, and attachments. Any tasks that were already copied into maintenance plans or work orders stay intact — they simply lose their "originated from" reference to the deleted group.

Permissions follow existing edit rights, so no new permission flag is required.
Faster Sensor Chart Rendering
We've rebuilt the IoT Dashboard chart widget to use a new bucketed-summary query path with caching. Charts now load noticeably faster, especially for high-volume sensors, and busy dashboards feel more responsive overall.
Custom Status Tracking on Work Orders
We've added support for custom status IDs on work orders, mapped to the underlying system statuses. Status transitions are now logged with more detail, giving you a clearer history of where each work order has been and who moved it.
Enhancements
v1.5.1 UI Refresh
We refactored the components used across the maintenance analysis screens for better performance and more consistent styling across tables and dialogs.

Stable Dashboard Widgets
Widgets no longer remount unnecessarily when a dashboard is refreshed. In-flight chart fetches are now preserved, which reduces flicker and eliminates redundant network calls when you open or reload a dashboard.
Cleaner Chart Rendering
The ModernCharts component now handles data availability more gracefully, with improved trend-calculation logic when points are missing or sparse.
Recent Activities Panel Fix
On the Maintenance Plan record screen, long activity lists now scroll correctly inside the rounded container instead of overflowing past the bottom border.
Bug Fixes
- Fixed a navigation crash triggered by certain page transitions.
- Fixed rendering issues affecting IoT dashboards.
- Fixed a bug in the work order close flow.
- Fixed dashboard widgets dropping in-flight data fetches during refreshes.
Developer's Note: If you experience a problem with any of the new updates or the system in general, please contact our support team at support@iox-connect.com so we can assist you as soon as possible.
Menu Icon Update
We’ve replaced all of the old, inconsistent menu and page icons with a unified, updated icon set. While this may seem like a small change, it makes the system easier to manage and is an important step toward the broader modernization planned for this year.

New Count Widget Added
We’ve added a new Count Widget to IoT Dashboards. This widget lets you count records in your system using specific filters. You can customize it and add multiple Count Widgets to a dashboard to track anything from the number of alarming sensors to assets with a particular operating status.


New Quick View Drawer
We’ve added a new quick view drawer for multiple widgets. Look for the eye icon on a widget—clicking it opens a side panel that shows key device information instantly, without leaving your current page. This lets you review sensor details without navigating to the full sensor record, improving the user experience and reducing the number of clicks required.

New GEO Map Widget
We’ve added a new GEO Map widget to IoT Dashboards. This widget lets you place markers on a map, visualize device clusters clearly, and add navigation links inside map pins for advanced navigation and seamless linking between dashboards.


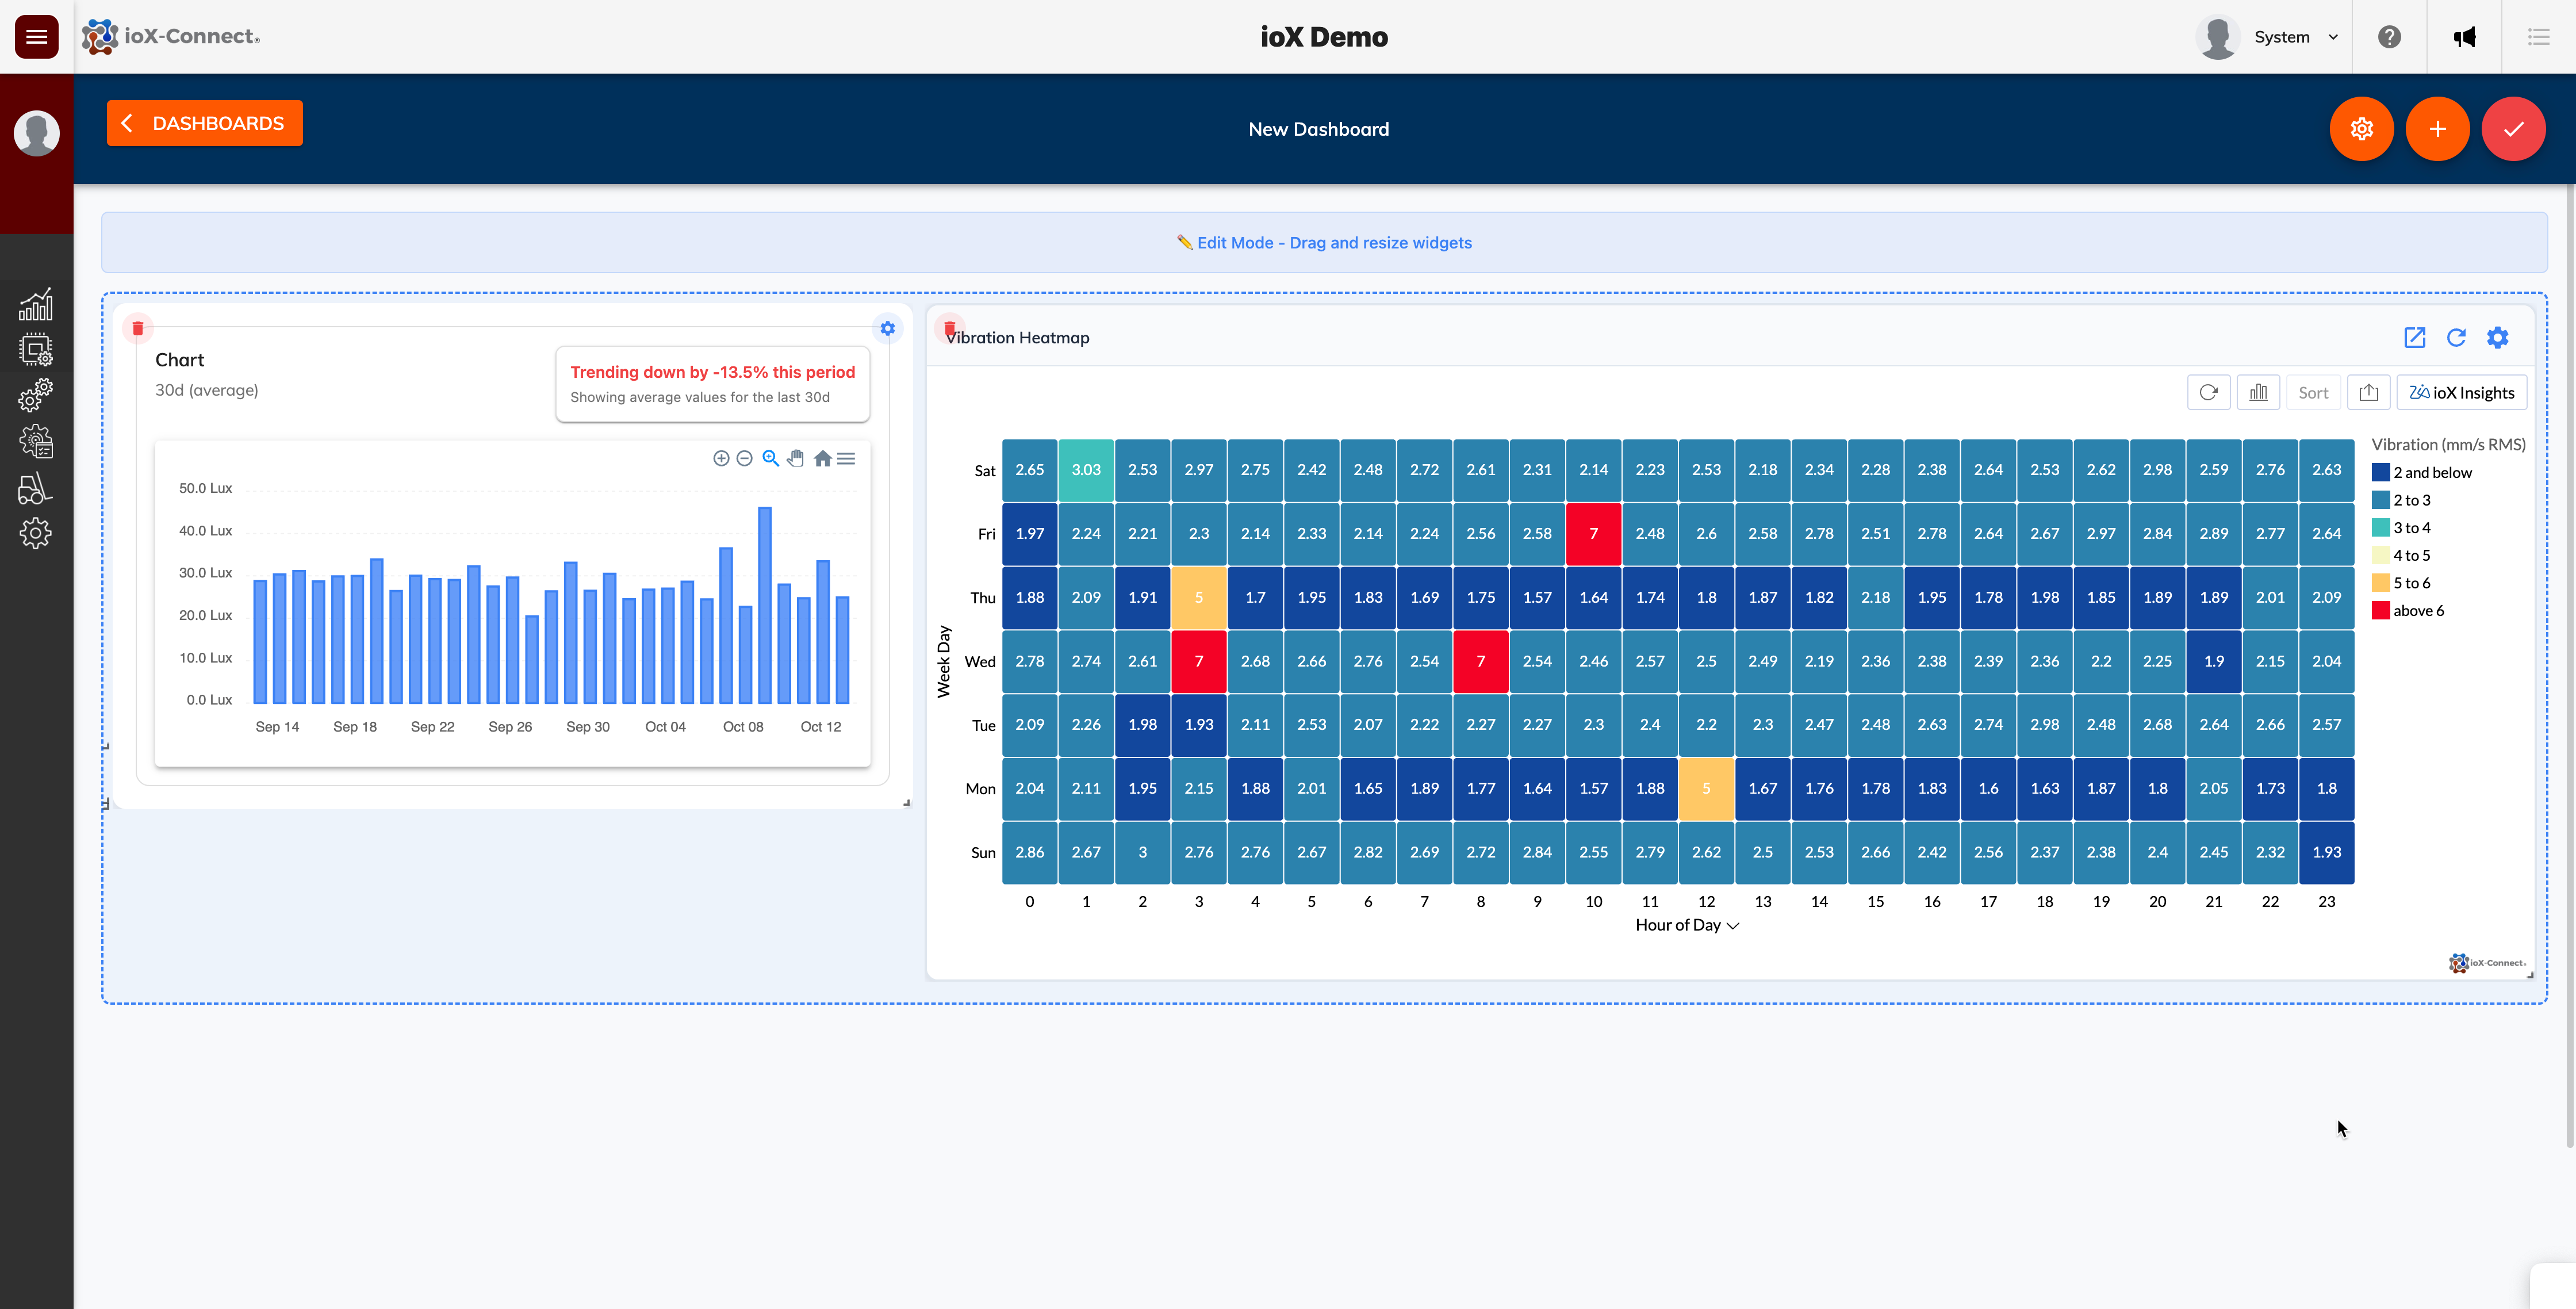
IoT Dashboards Update
Developer's Note: The release of our updated IoT Dashboards, is aimed at improving customer experience and allowing users to create their own IoT dashboards without needing input from our team. That being said, this is an initial release and we expect there to be some issues. Your feedback is essential—reporting any issues promptly helps us resolve them quickly and ensures that we can work to enhance the platform and improve this new functionality. If you experience a problem, please contact our support team at support@iox-connect.com so we can assist you as soon as possible.
Dashboards New Look
We implemented a completely new look and navigation for IoT Dashboard. This is a significant improvement from the previous display and allows users with multiple dashboards to more easily navigate this section.
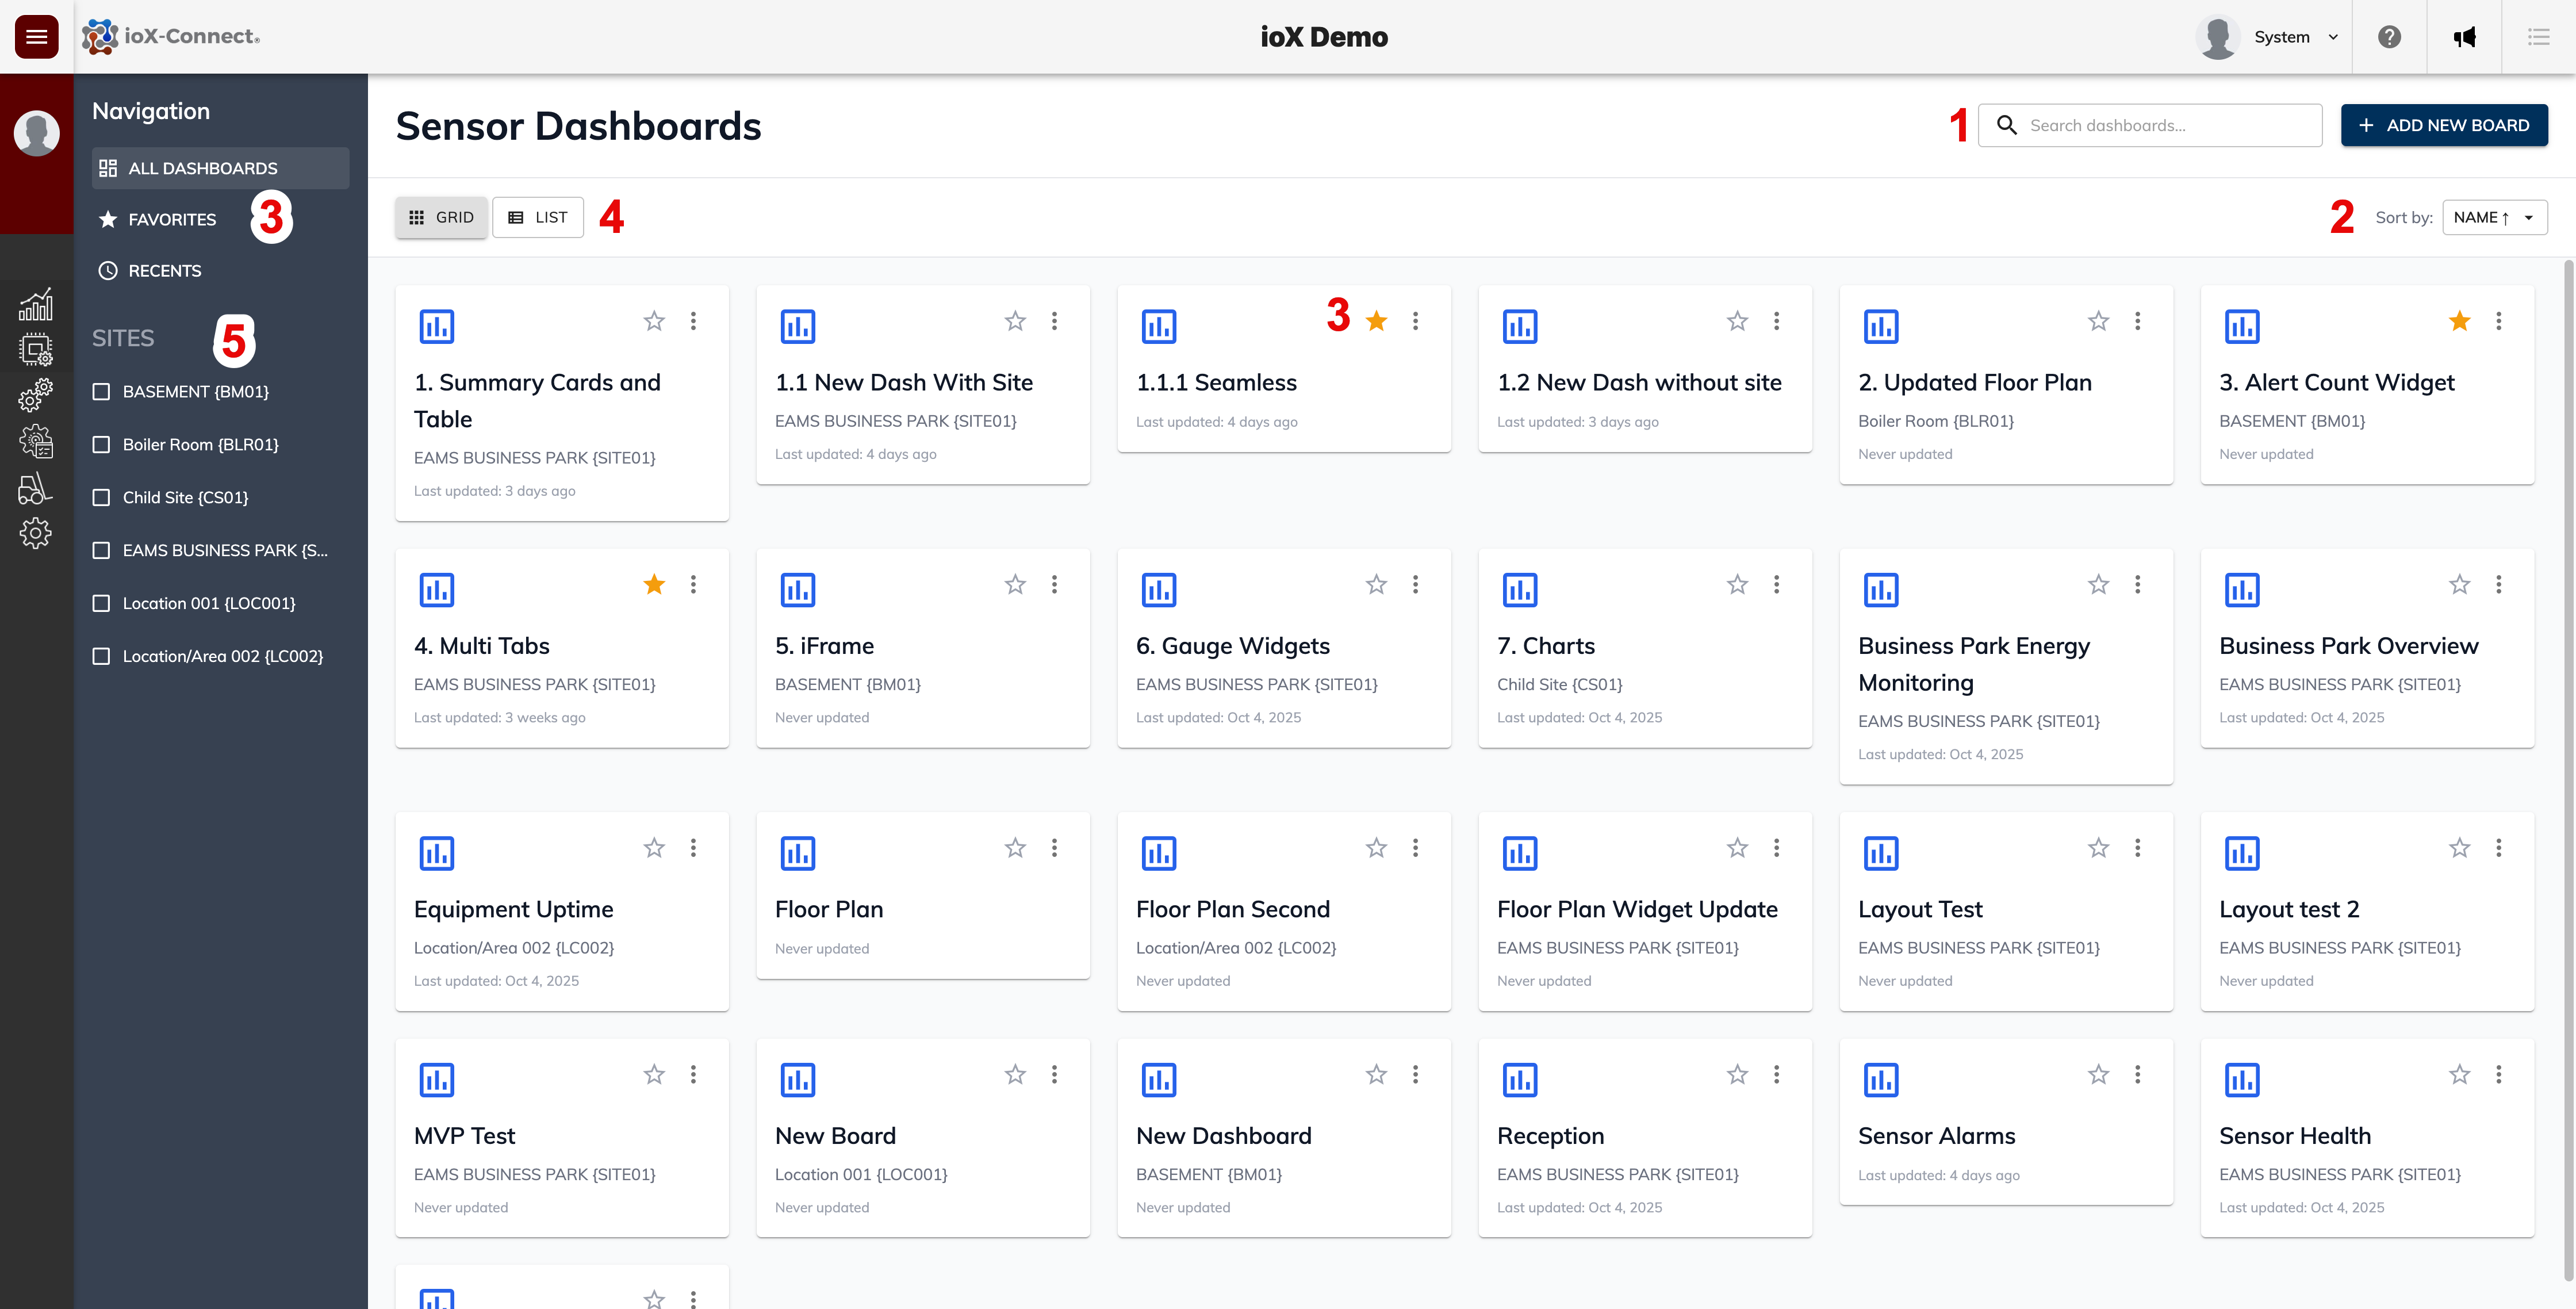
1. Search for dashboards by linked site or dashboard name.
2. Sort the dashboard view by Name, Date Created or Site
3. Favorite a dashboard and use the quick filter under the navigation bar to quickly find your favorite dashboards
4. Switch between a grid view and a list view of dashboards.
5. Use the quick site filter in the left menu to filter dashboards by linked site.
Dashboard Tabs
We've added multi-tab functionality to the IoT Dashboards. This allows users to create multiple tabs for a dashboard and have multiple widgets per tab. Useful if you want to have a single dashboard for a site that has different sensors deployed.

1. To enable tabs on a dashboard, open the dashboard, click on the Settings icon to access the dashboard configuration window.
2. Click on the Enable Tabs slider
3. Give the new tab a name and click the Add Tab button. Repeat this to add additional tabs to your dashboard.
Dashboard Widgets
Developer's Note: We’re pleased to introduce the first set of new dashboard widgets, giving you more flexibility to build IoT dashboards tailored to your needs. This marks the start of a series of updates—expect additional widgets and expanded functionality in the coming months.
Known Issues: While this new functionality is now available, some widgets may still have minor bugs or issues that we are actively working to resolve. Some of these are as follows:
- The chart widget is missing a loading animation to indicate to the user that the chart data is loading data.
- There are some widget refresh issues we're aware of that might make it look like a widget has no data when it does and only dsplays that data after a short period.
- For the Floor Plan Map widget, the device pins when clicked does not display the sensor details like name, sensor code etc. We're working on a different display dialog to solve this.
- The conditional formatting of Floor Plan Map pins needs some additional logic to allow for custom color coding.
- The Alarm Count widget although it has a network filter, our team think it would be best to also add a site filter to this widget so we're working on that as well.
- The Sensor Table widget, we're working on expanding its functionality by adding a data export function to the widget, some additional list filters like network/site as well as a quick navigation link in the sensor list to allow users to navigate to any sensor clicked on in the list.
- Sensor summary card widget: We're fixing an issue with the sensor alarm/ sensor alarm acknowledgement state not properly being displayed on this widget.
There might be other bugs/issues not listed above, if you find any please let us know by emailing our team at: support@iox-connect.com if there's a specific widget you think would benefit the platform, please fill out a Feature Request Form.
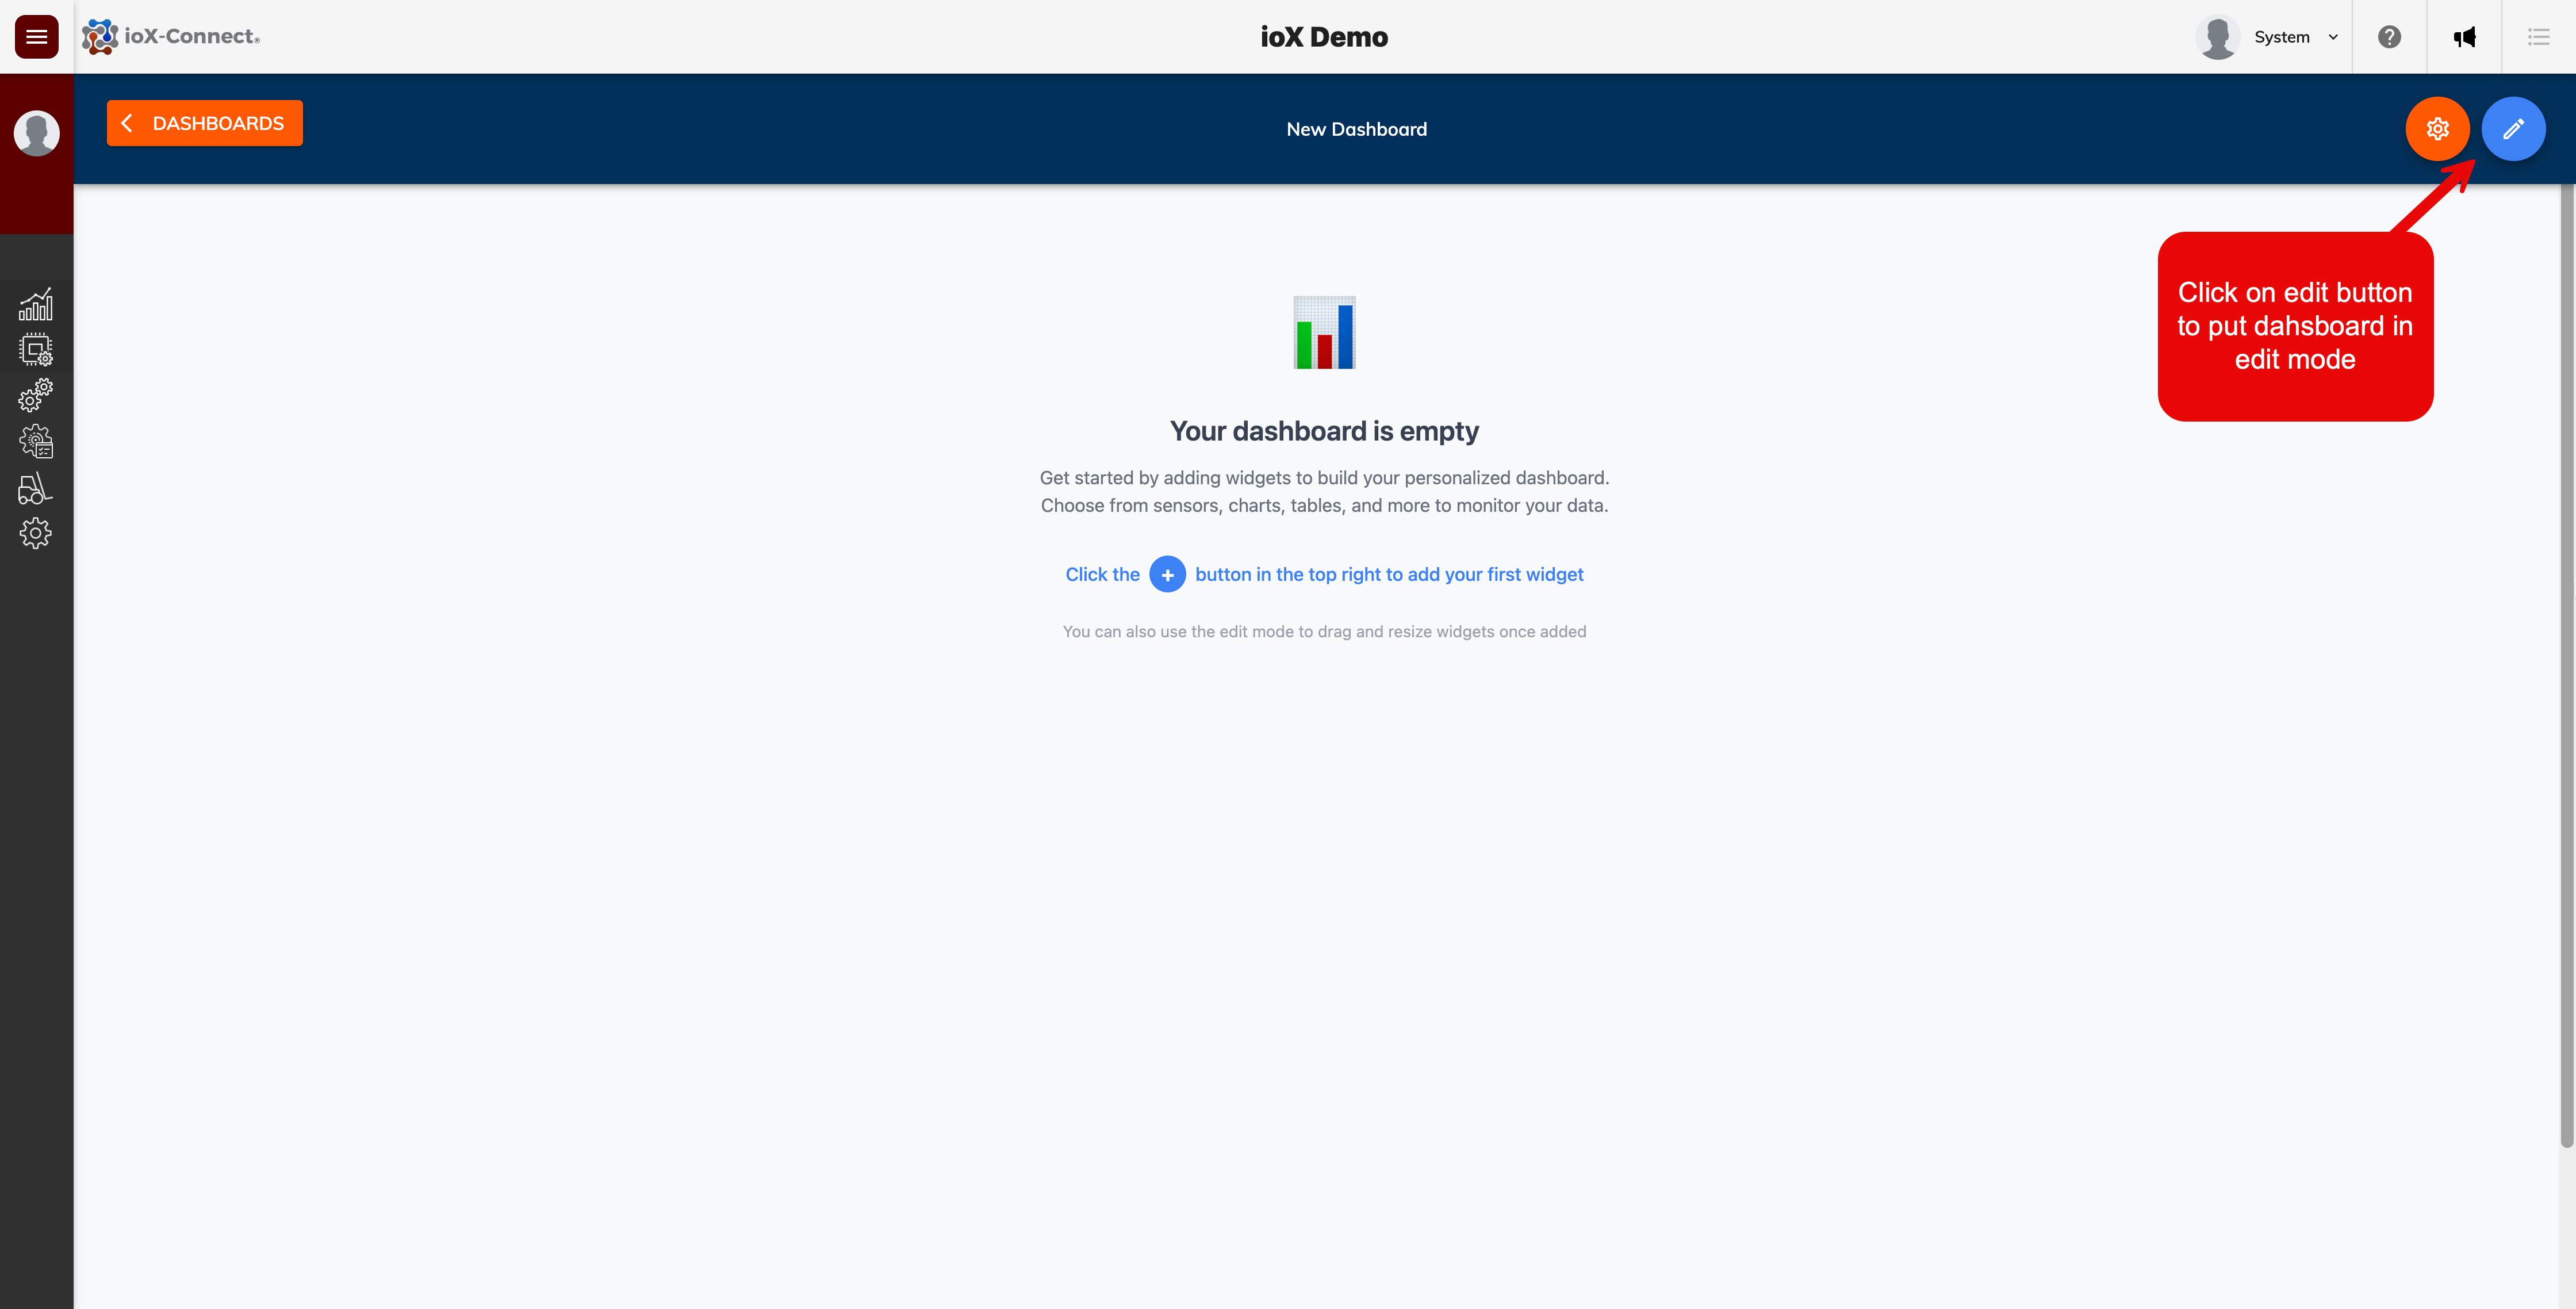
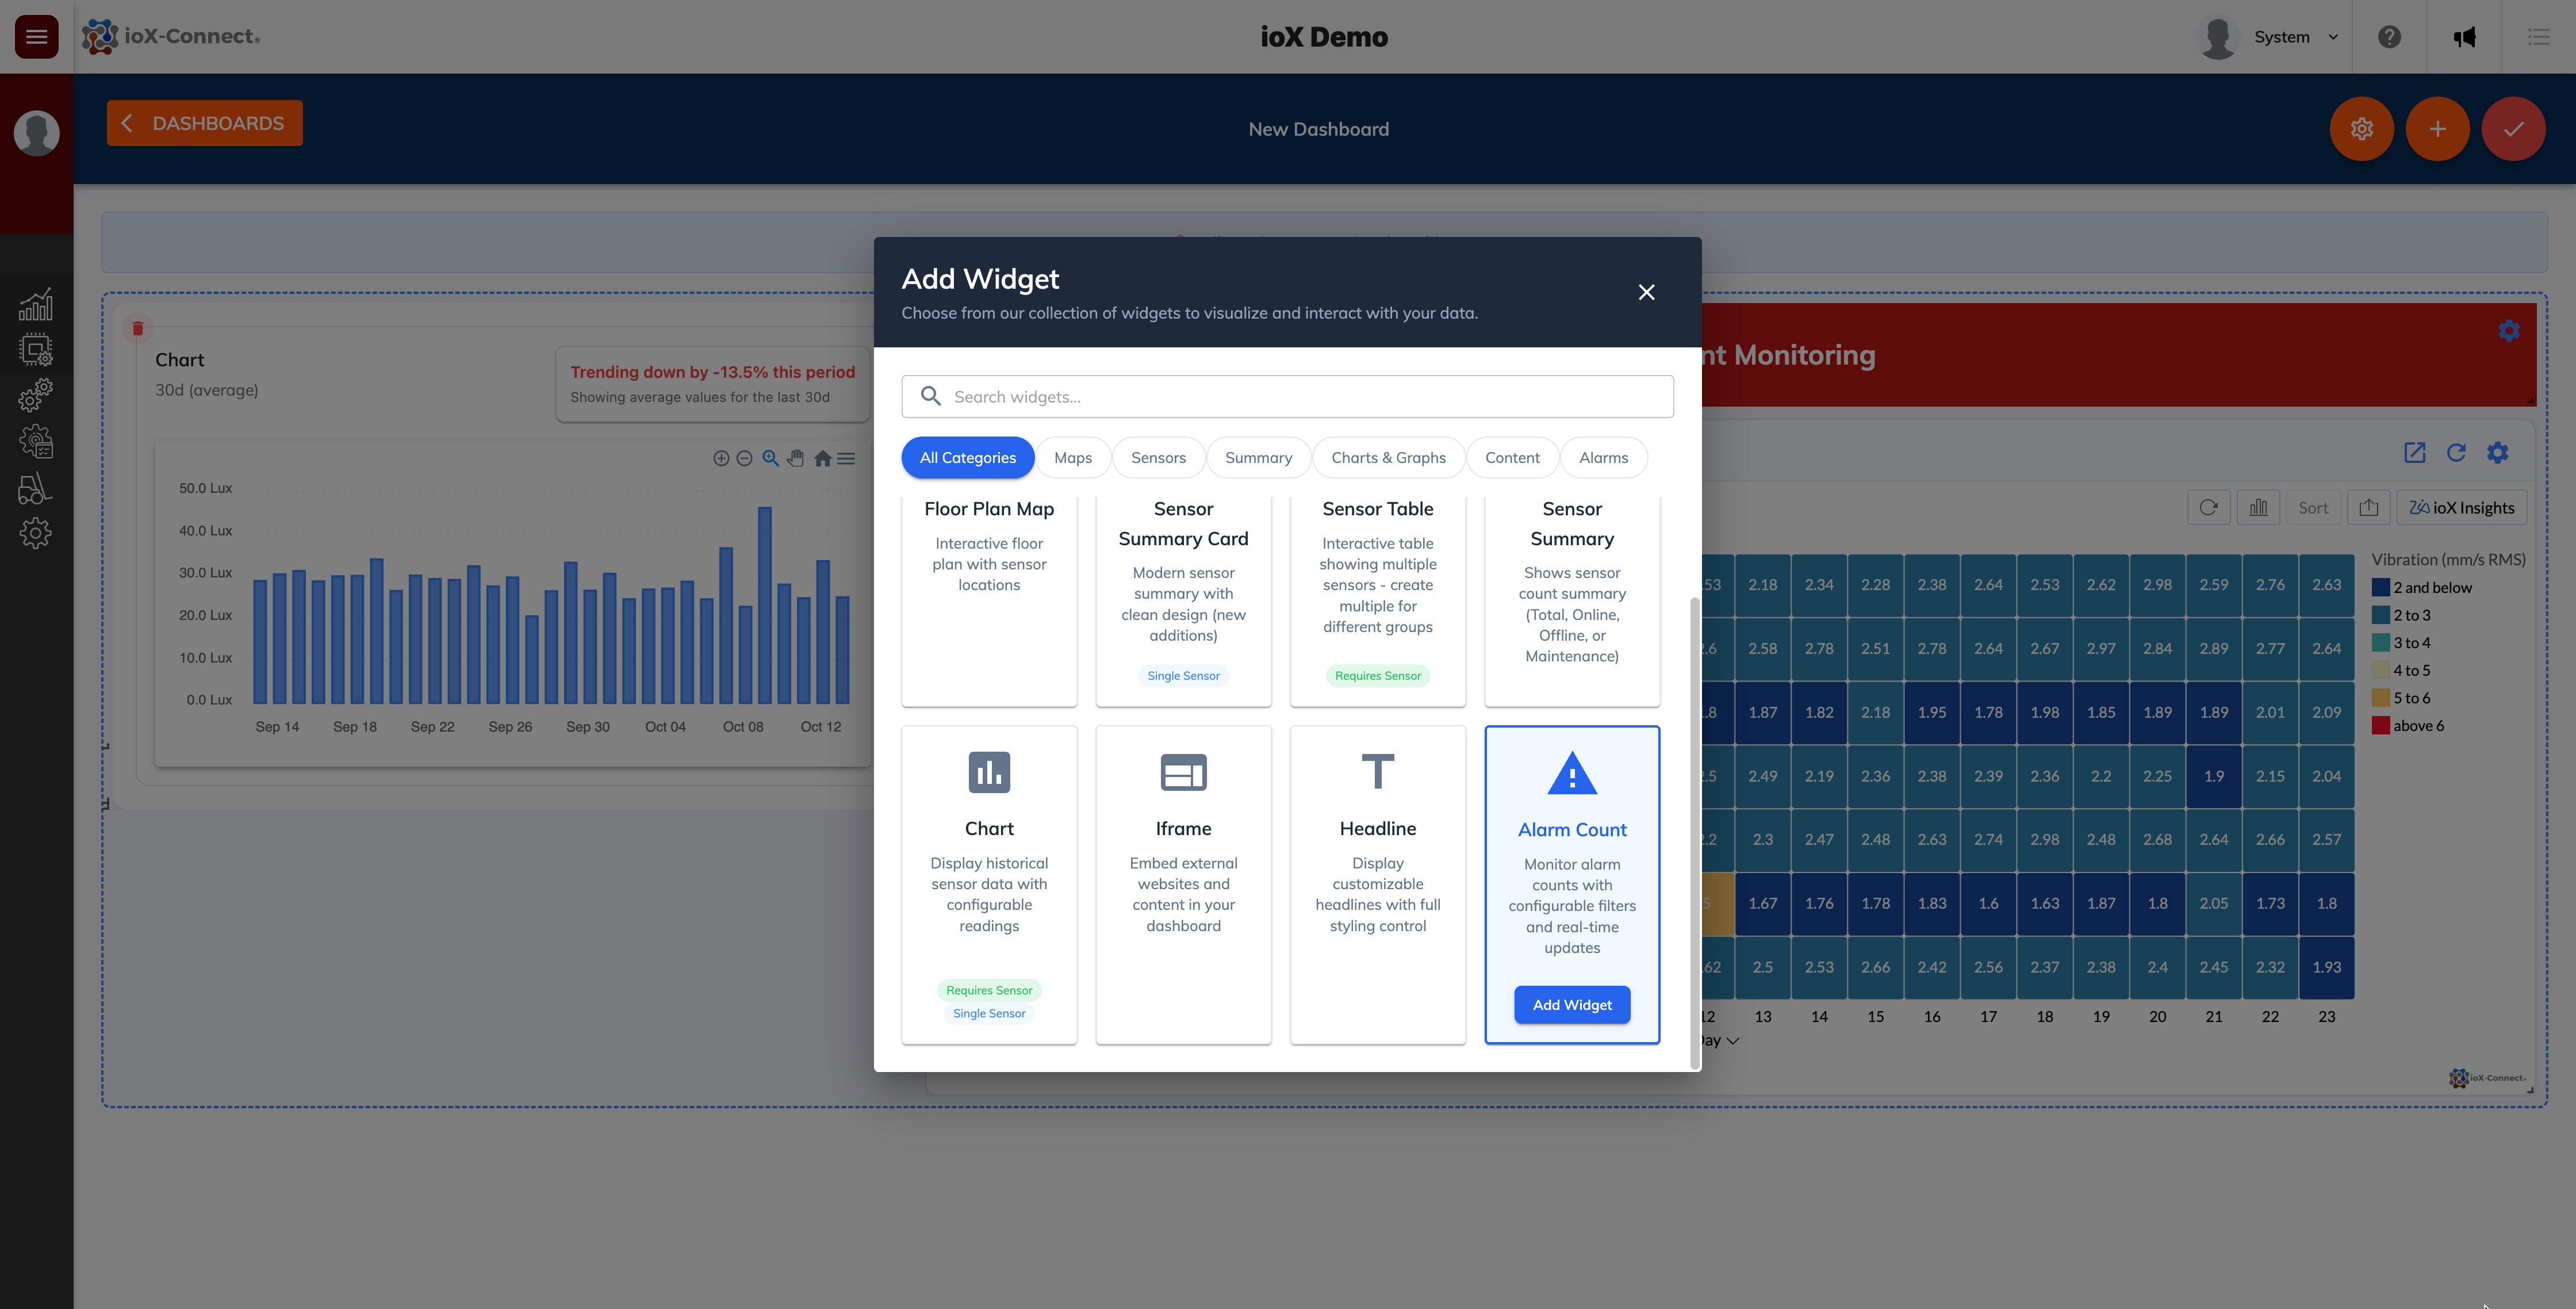
Add Widgets to Dashboard
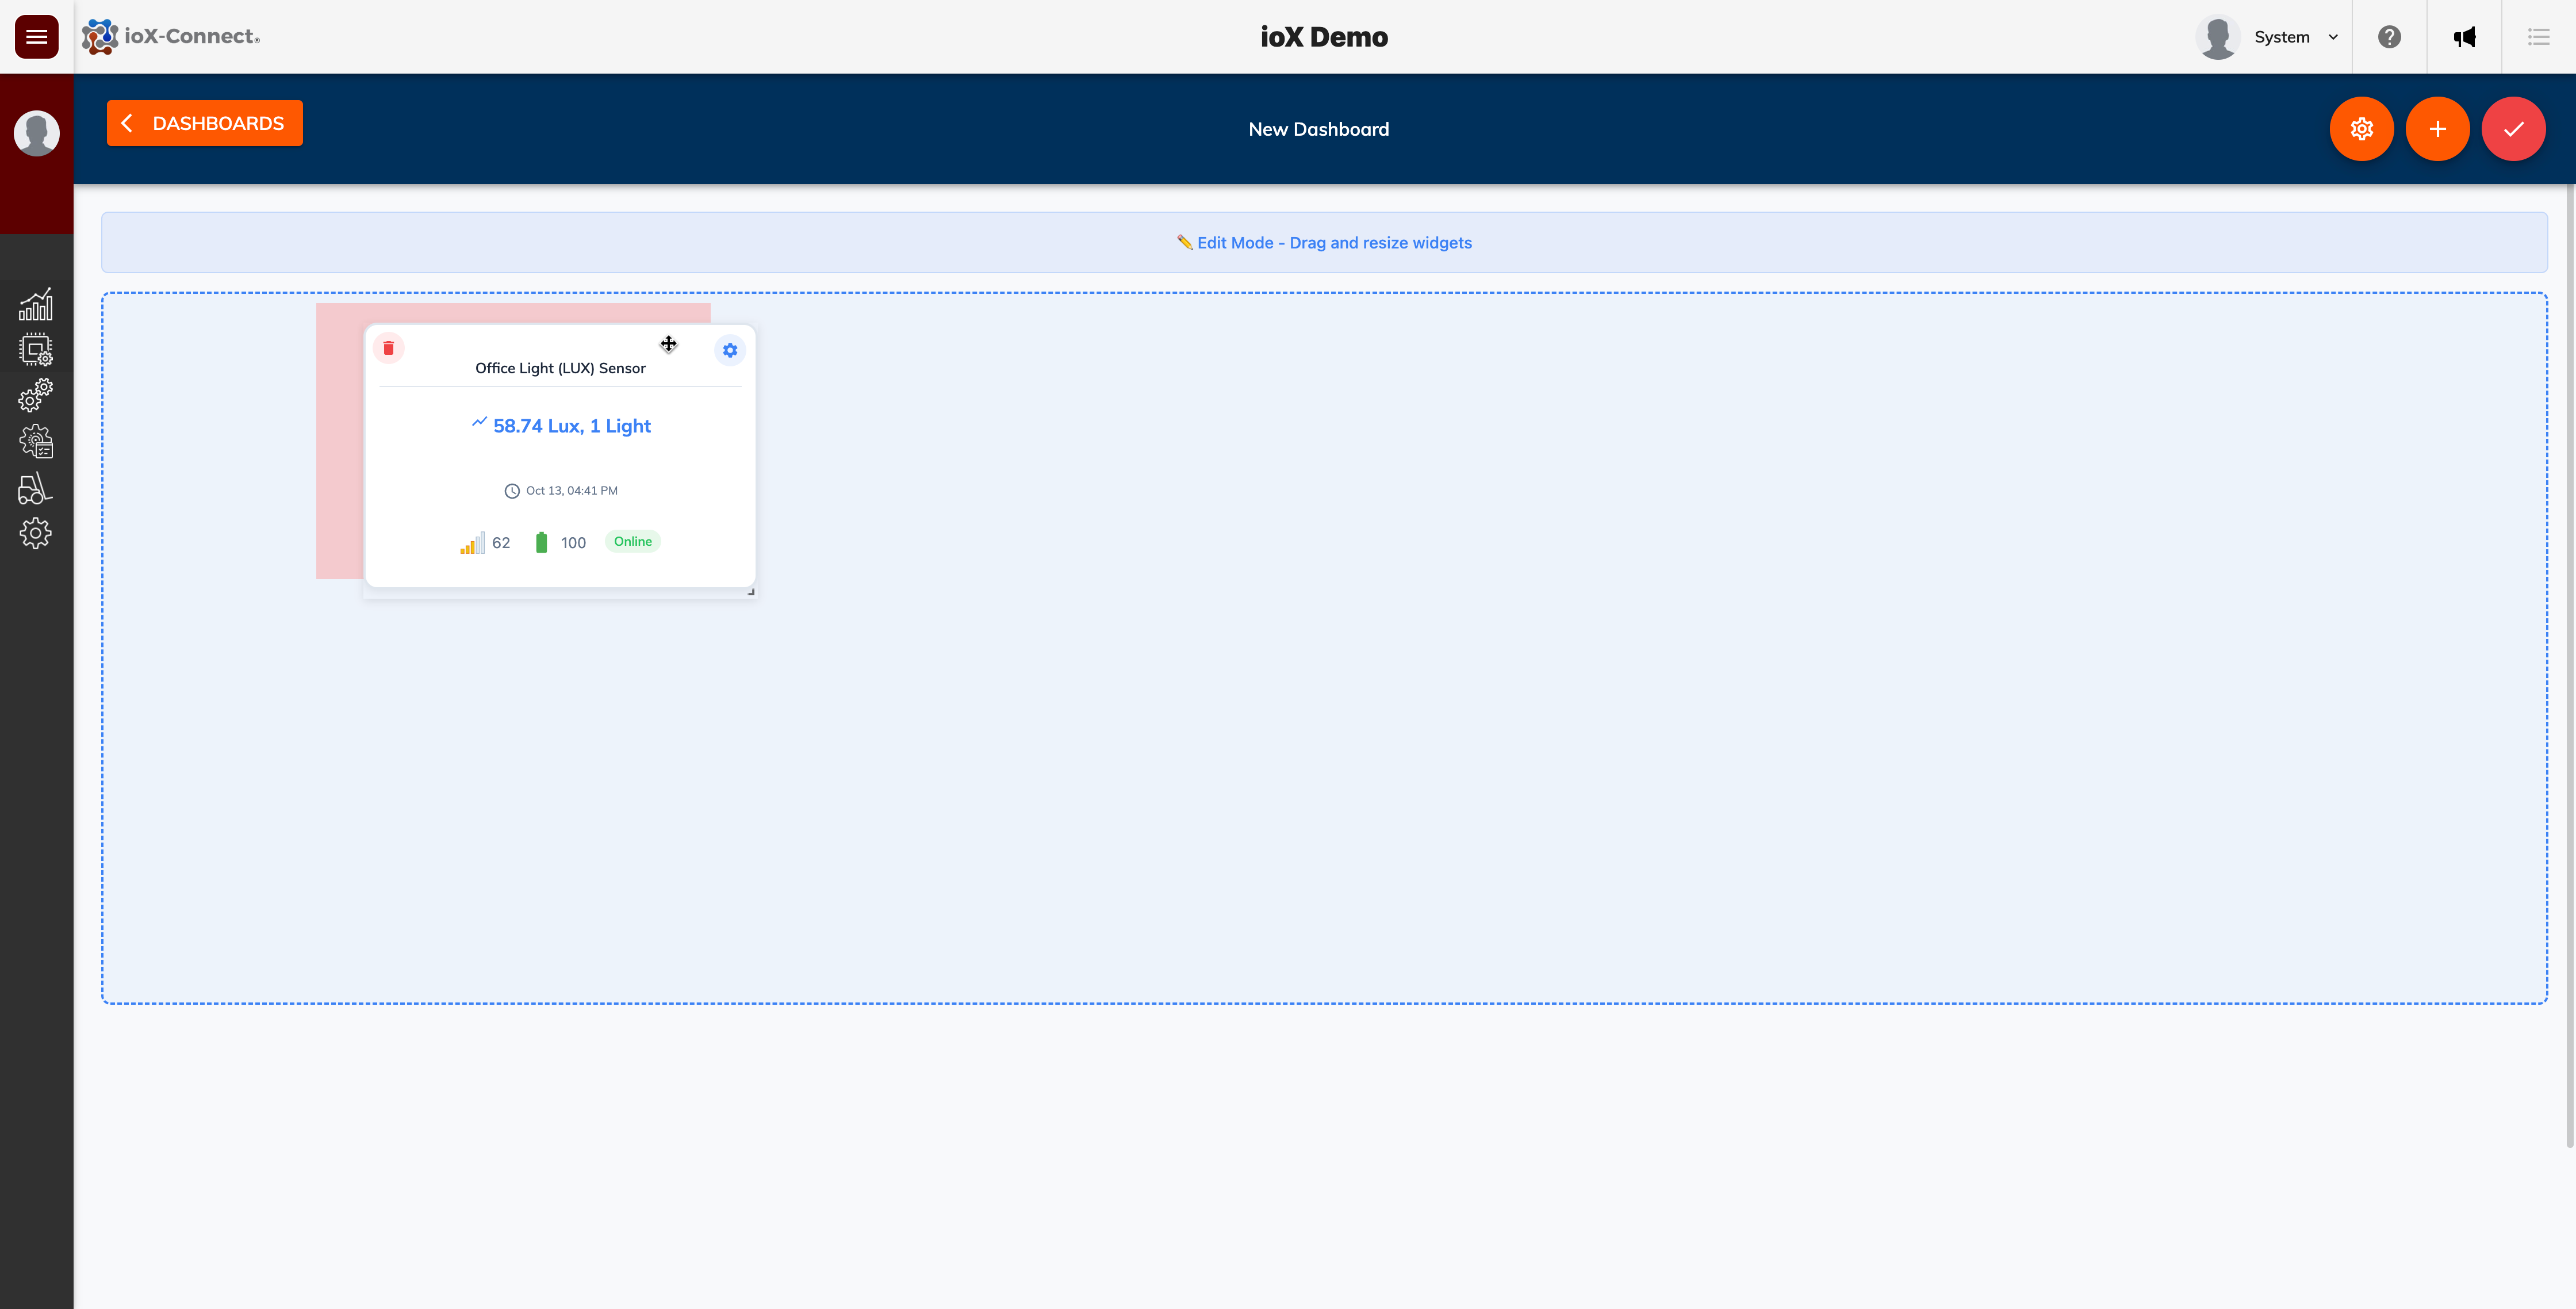
1. Put the dashboard into edit mode by clicking the dashboard edit button
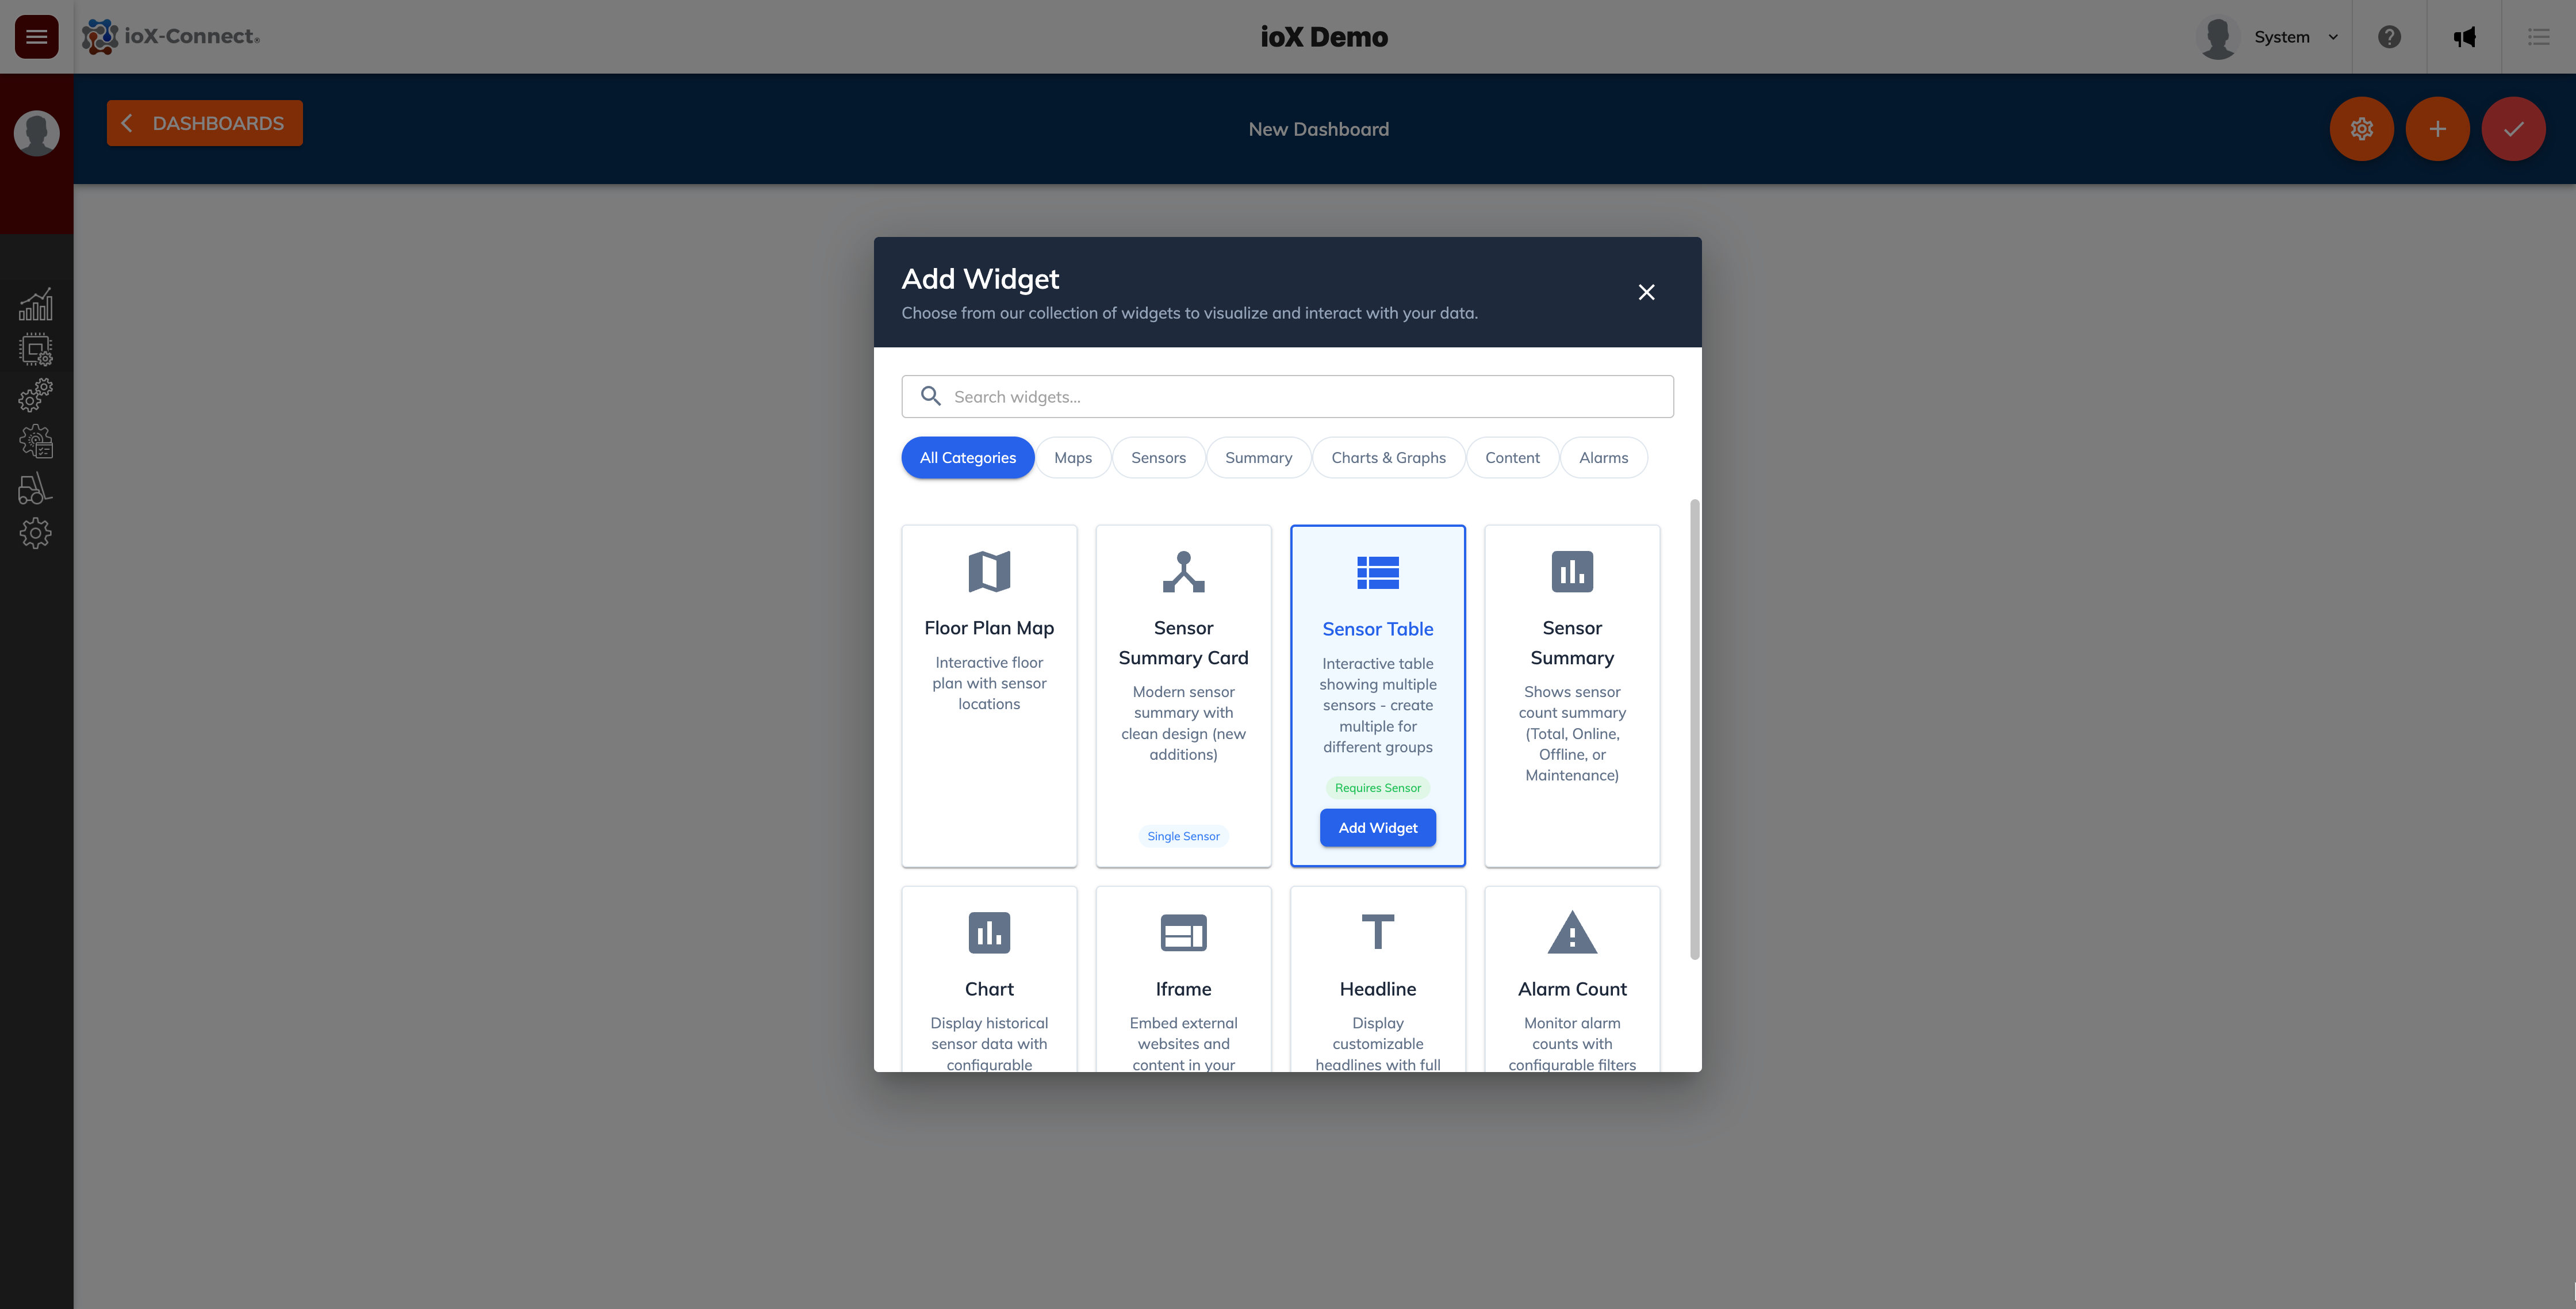
2. Click on the + add widget button and select the rquired widget from the widget list.

Floor Plan Map Widget
This widget allows you to add an image or floor plan image and plot sensor pins/locations on that image.
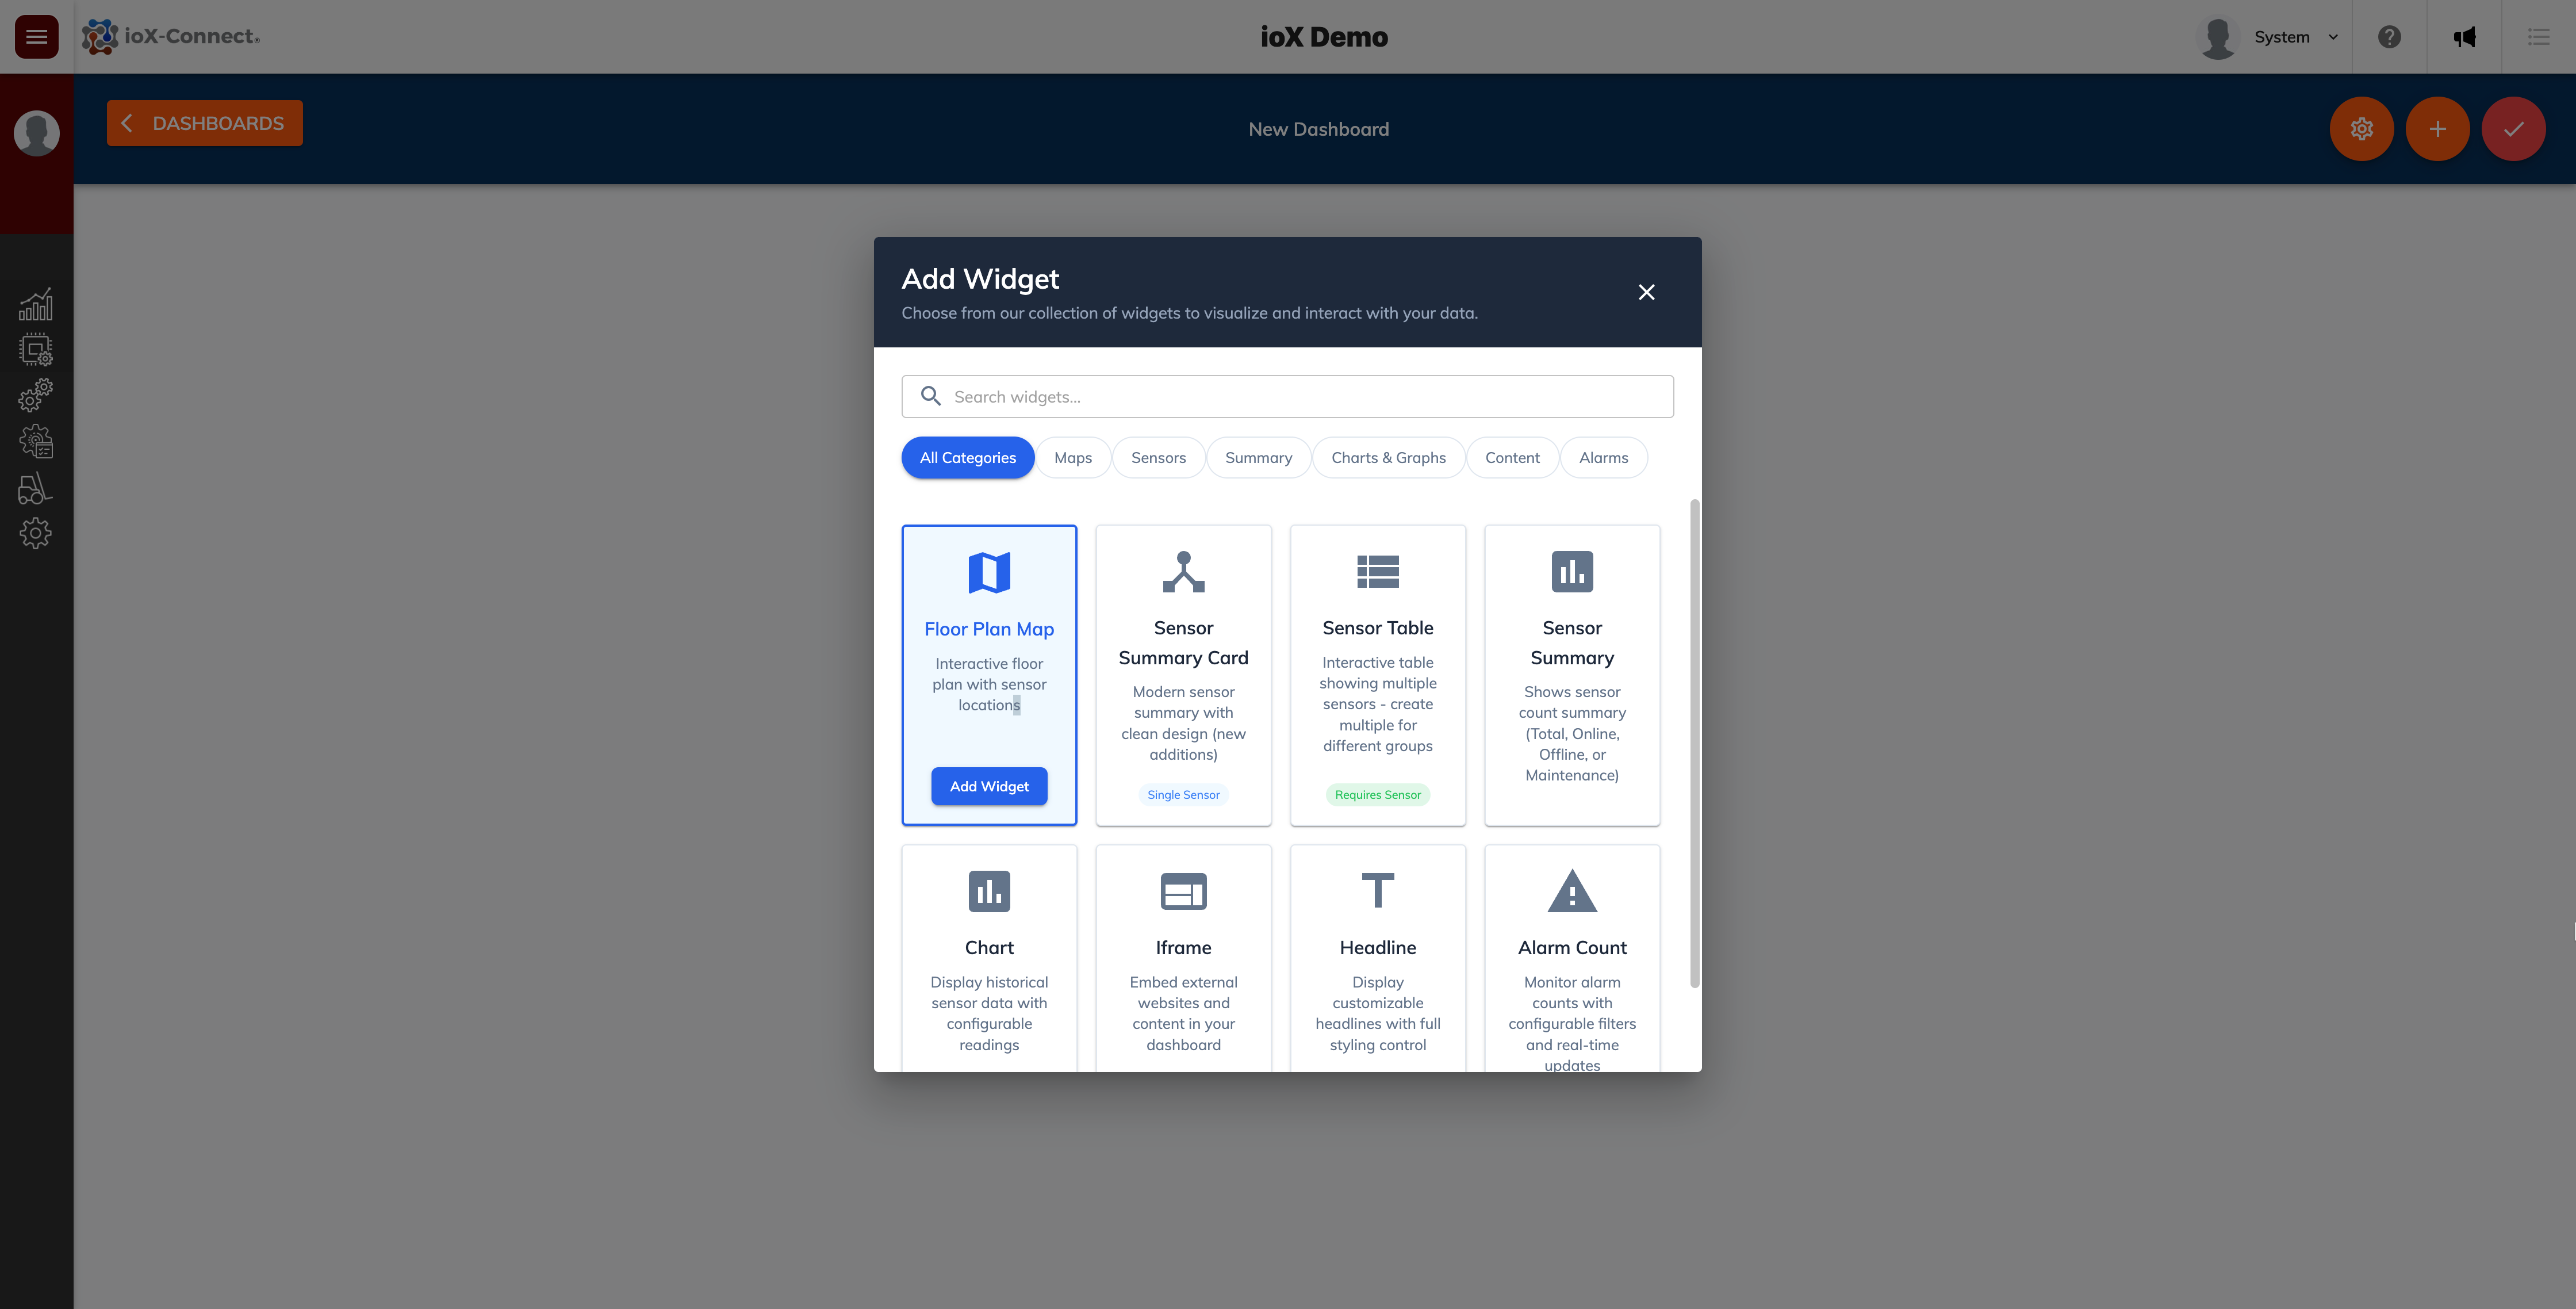

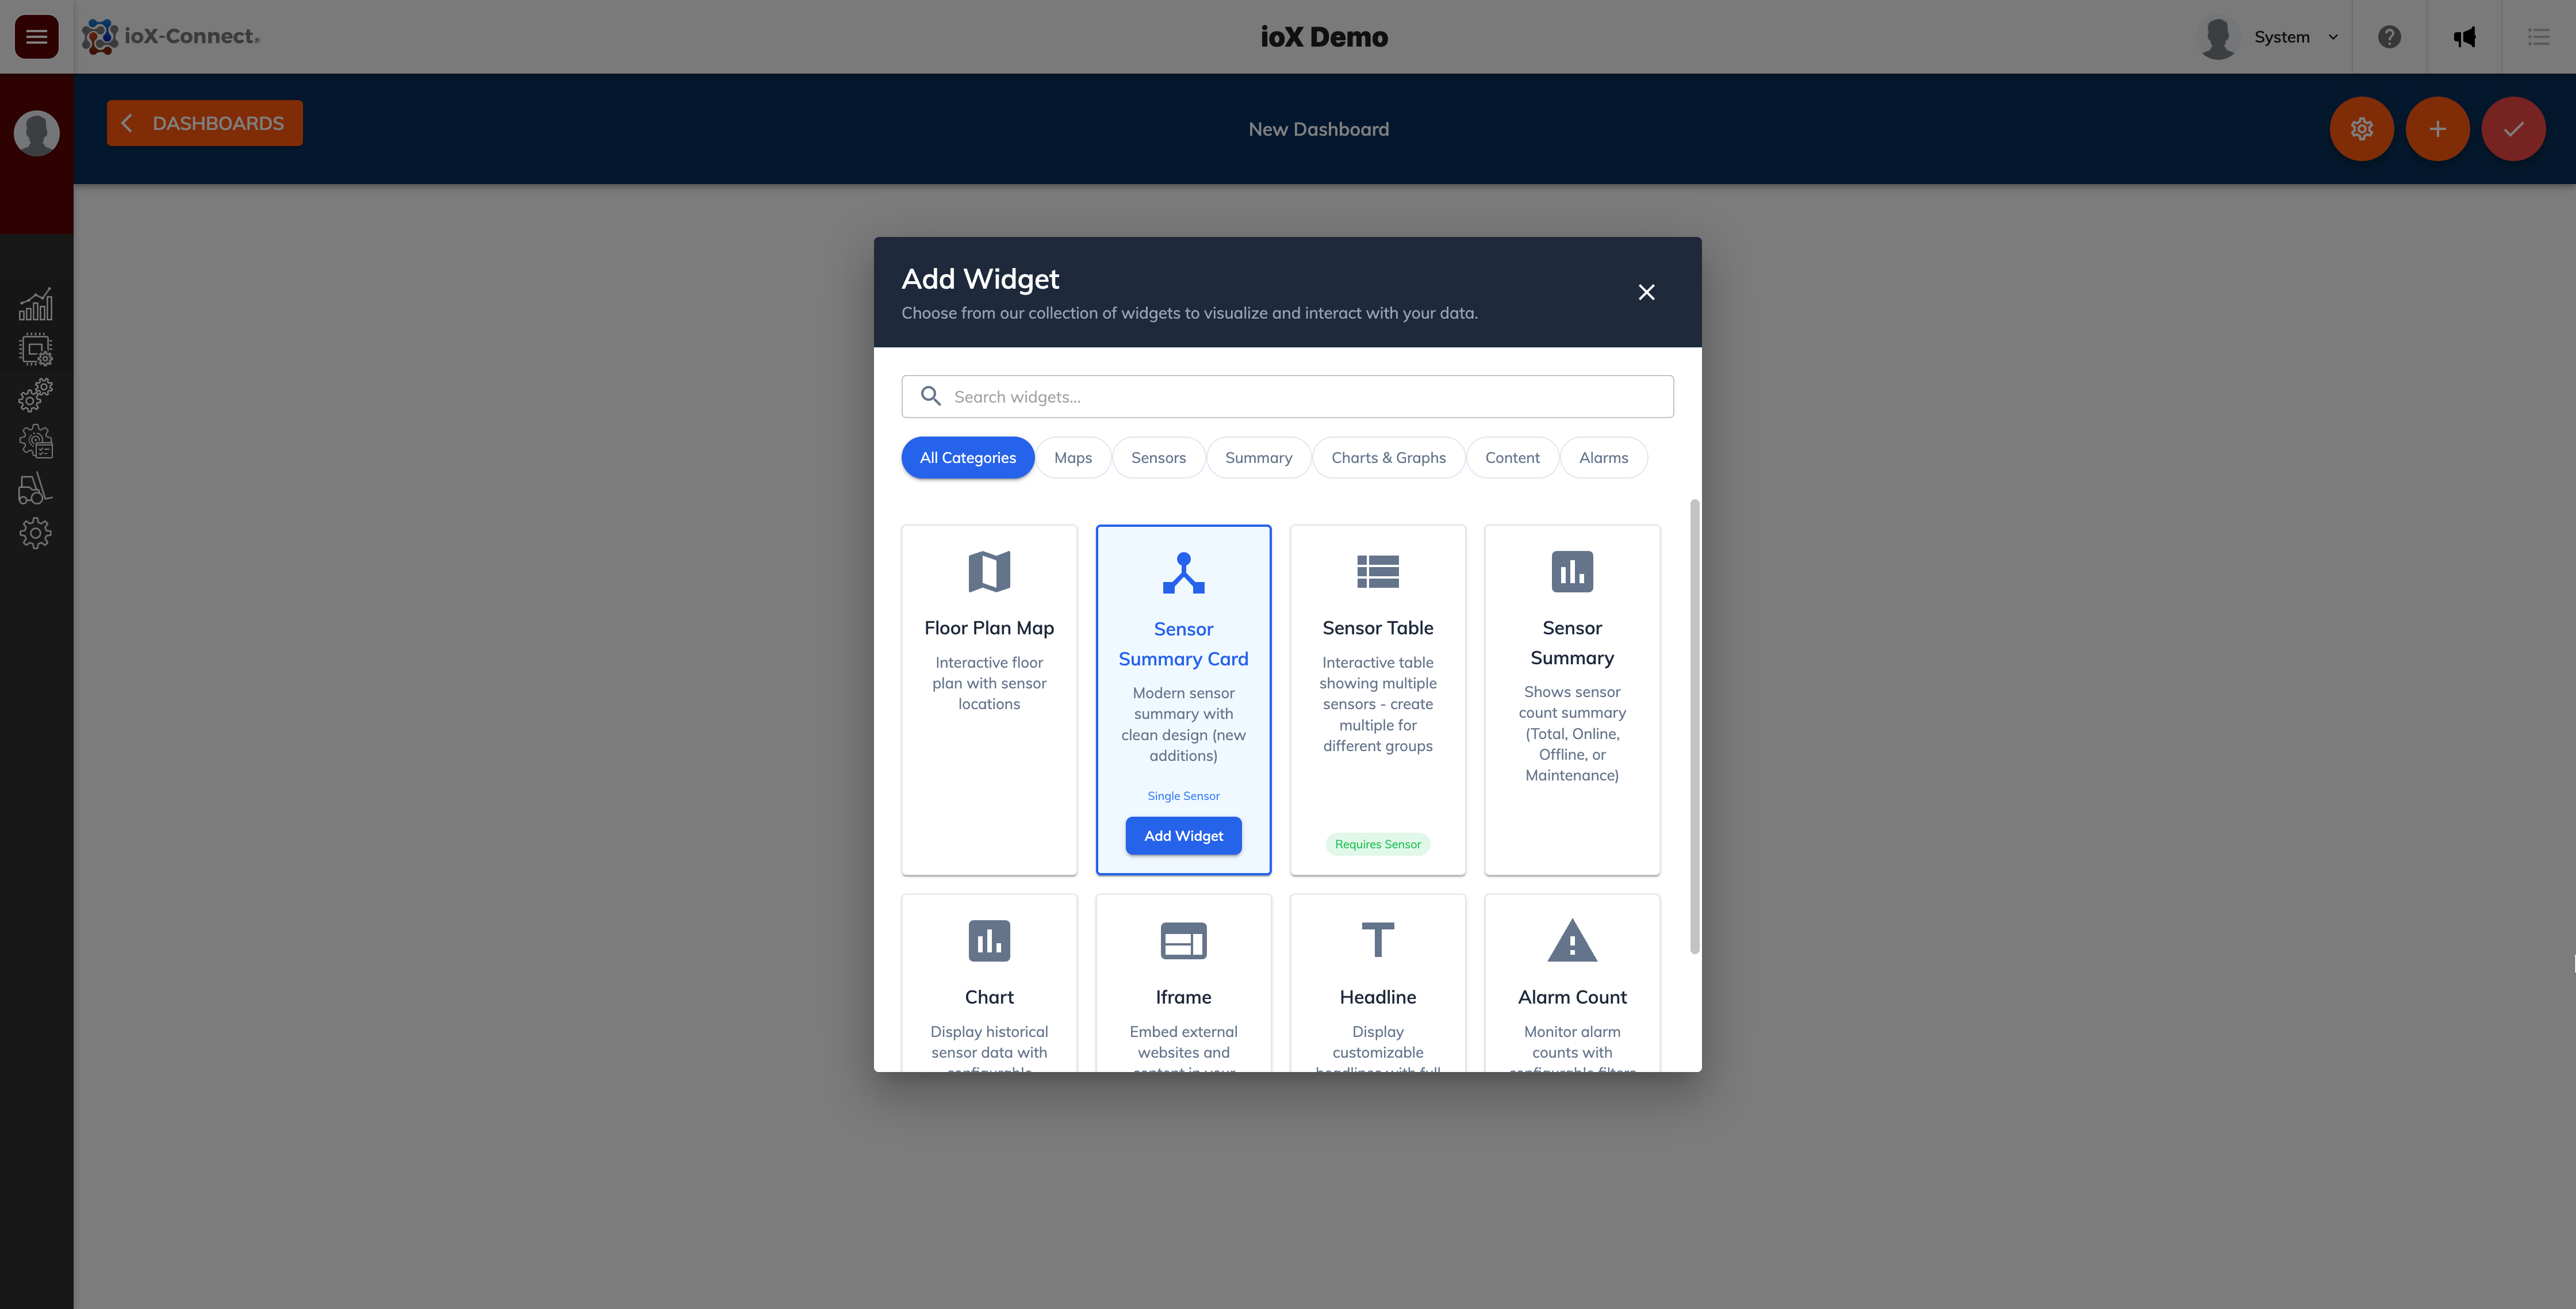
Sensor Summary Card Widget
This widget allows you to see the most recent sensor readings for a specified device. It will also flag if the sensor is alerting or if an alert has been acknowledged. While the dashboard is in edit mode, you can grab and move the widget around or change the widget's size.
Sensor Table
This widget is a table like widget that will display all selected sensors with their most current readings. The table will also show any sensors that are actively in an alarm state.

Sensor Chart Widget
This widget is useful to show recent time series data for a selected sensor. You can select between an area, line or bar chart to display up to the last 12 month's worth of data for a sensor.
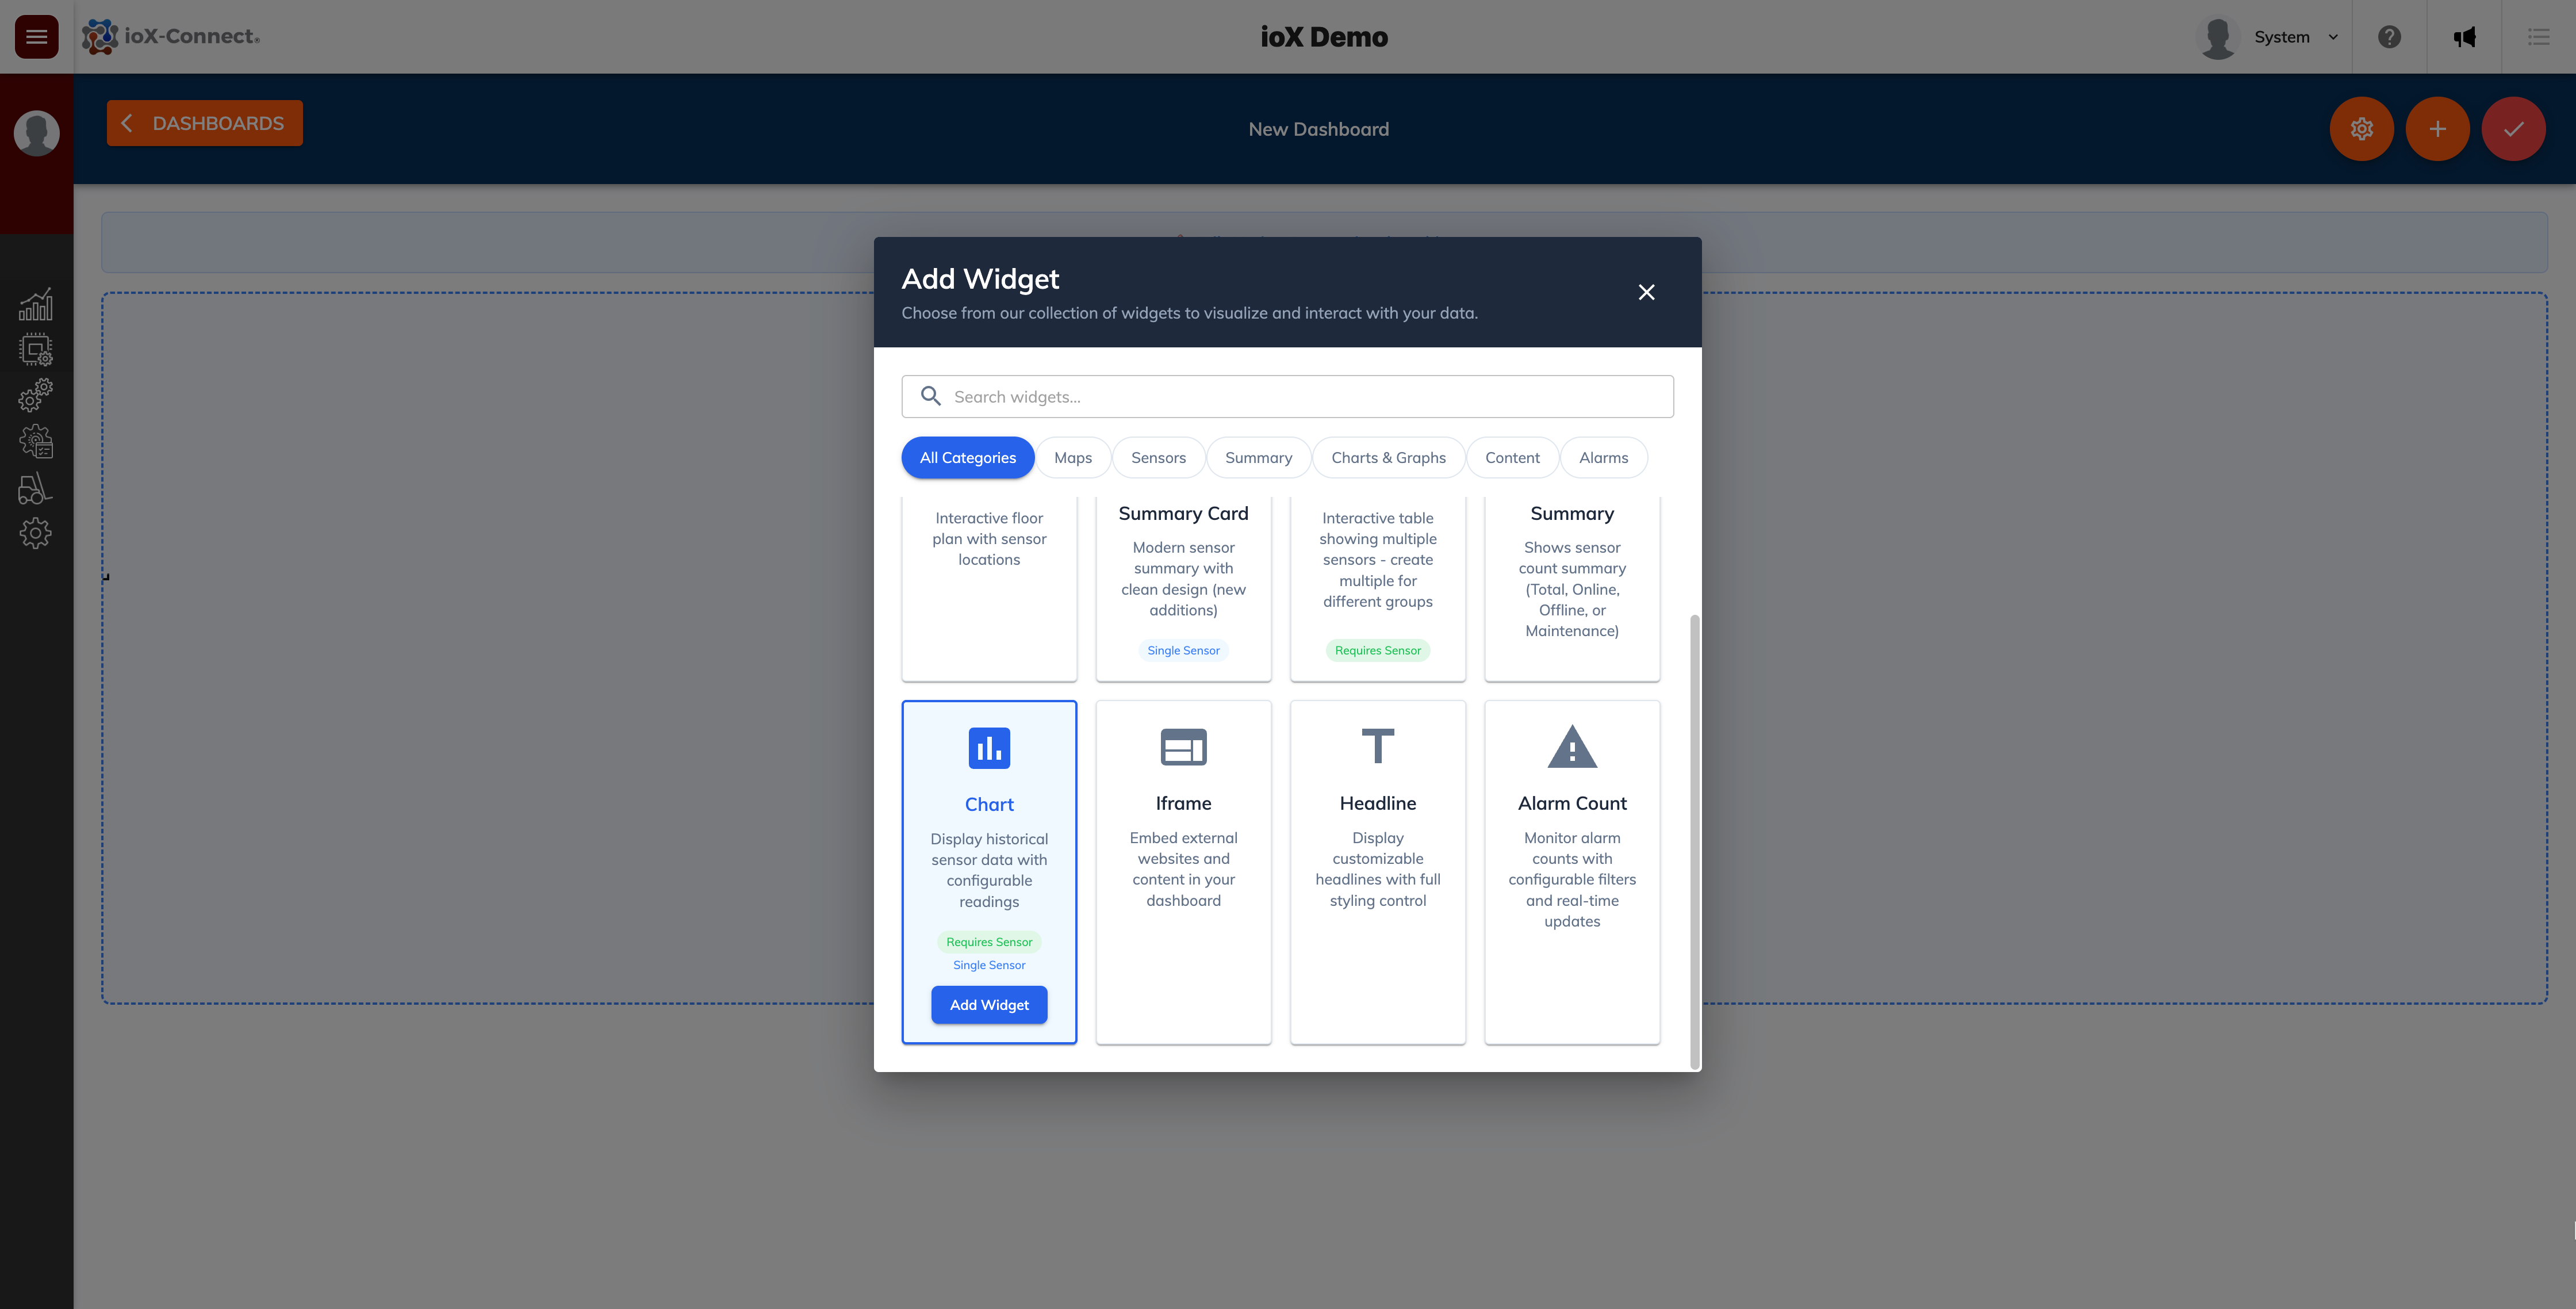

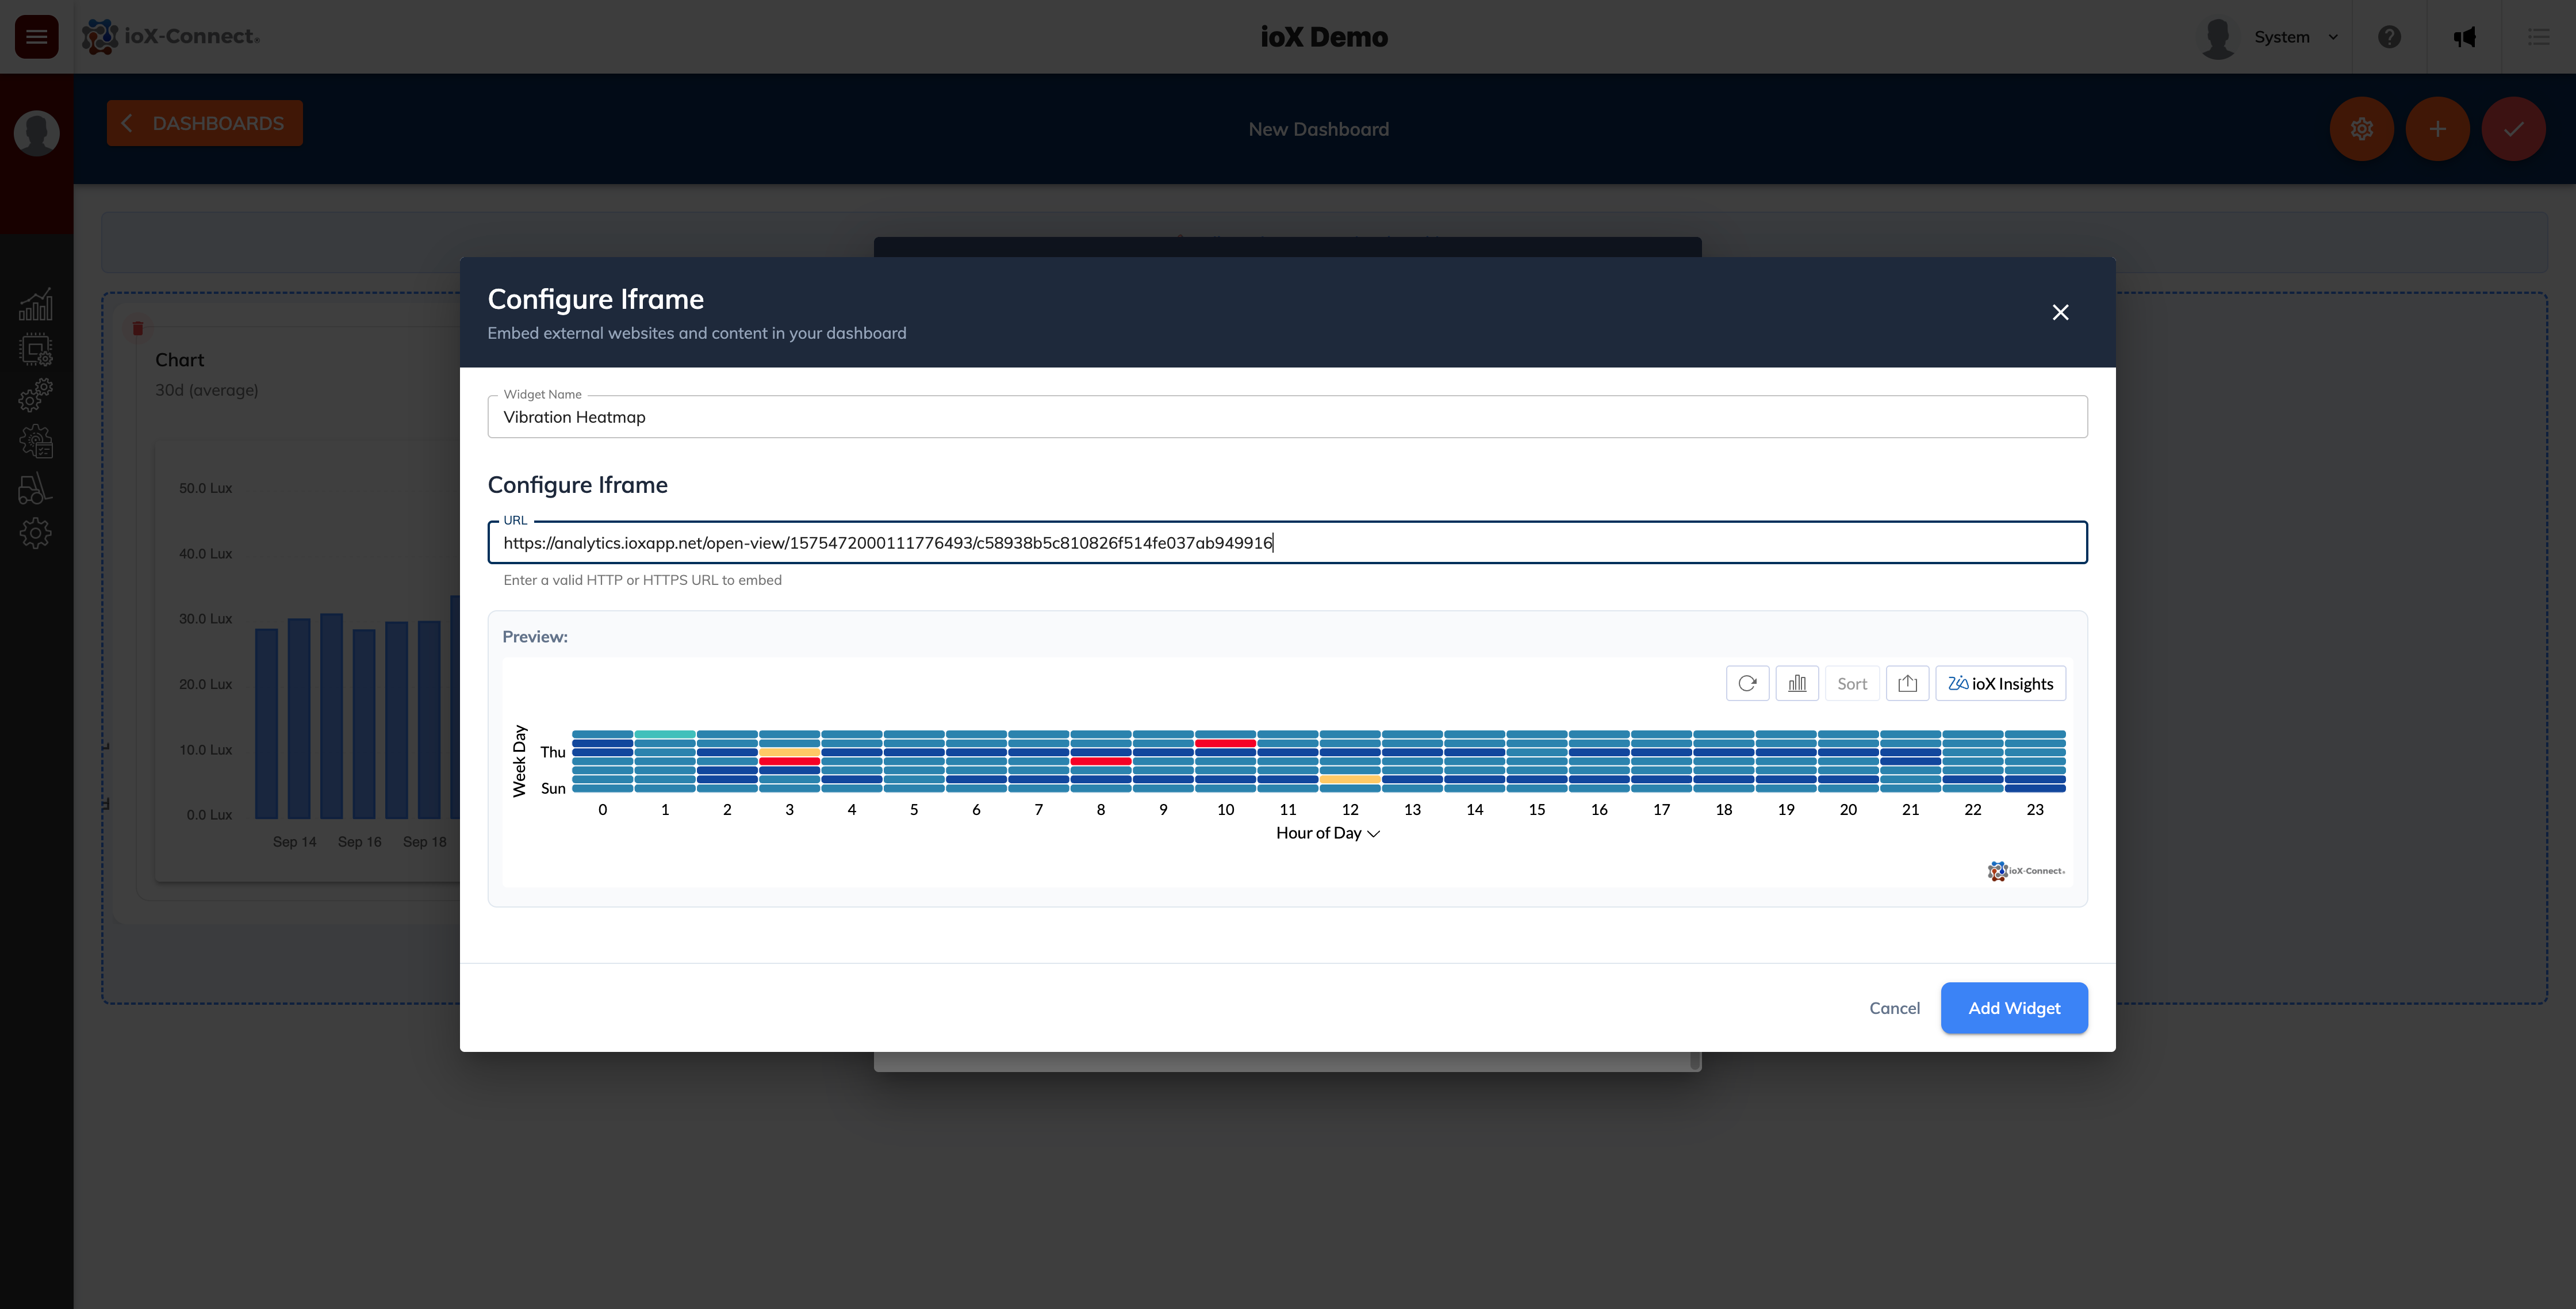
iFrame Widget
The iframe widget will allow you to embed a URL right into your IoT dashboard. Very useful for those customers that have an active ioX-Analytics subscription that want to show historical and trend data next to current sensor readings for example. The widget will allow you to embed and iframe any valid URL into the dashboard provided the URL allows iframing.

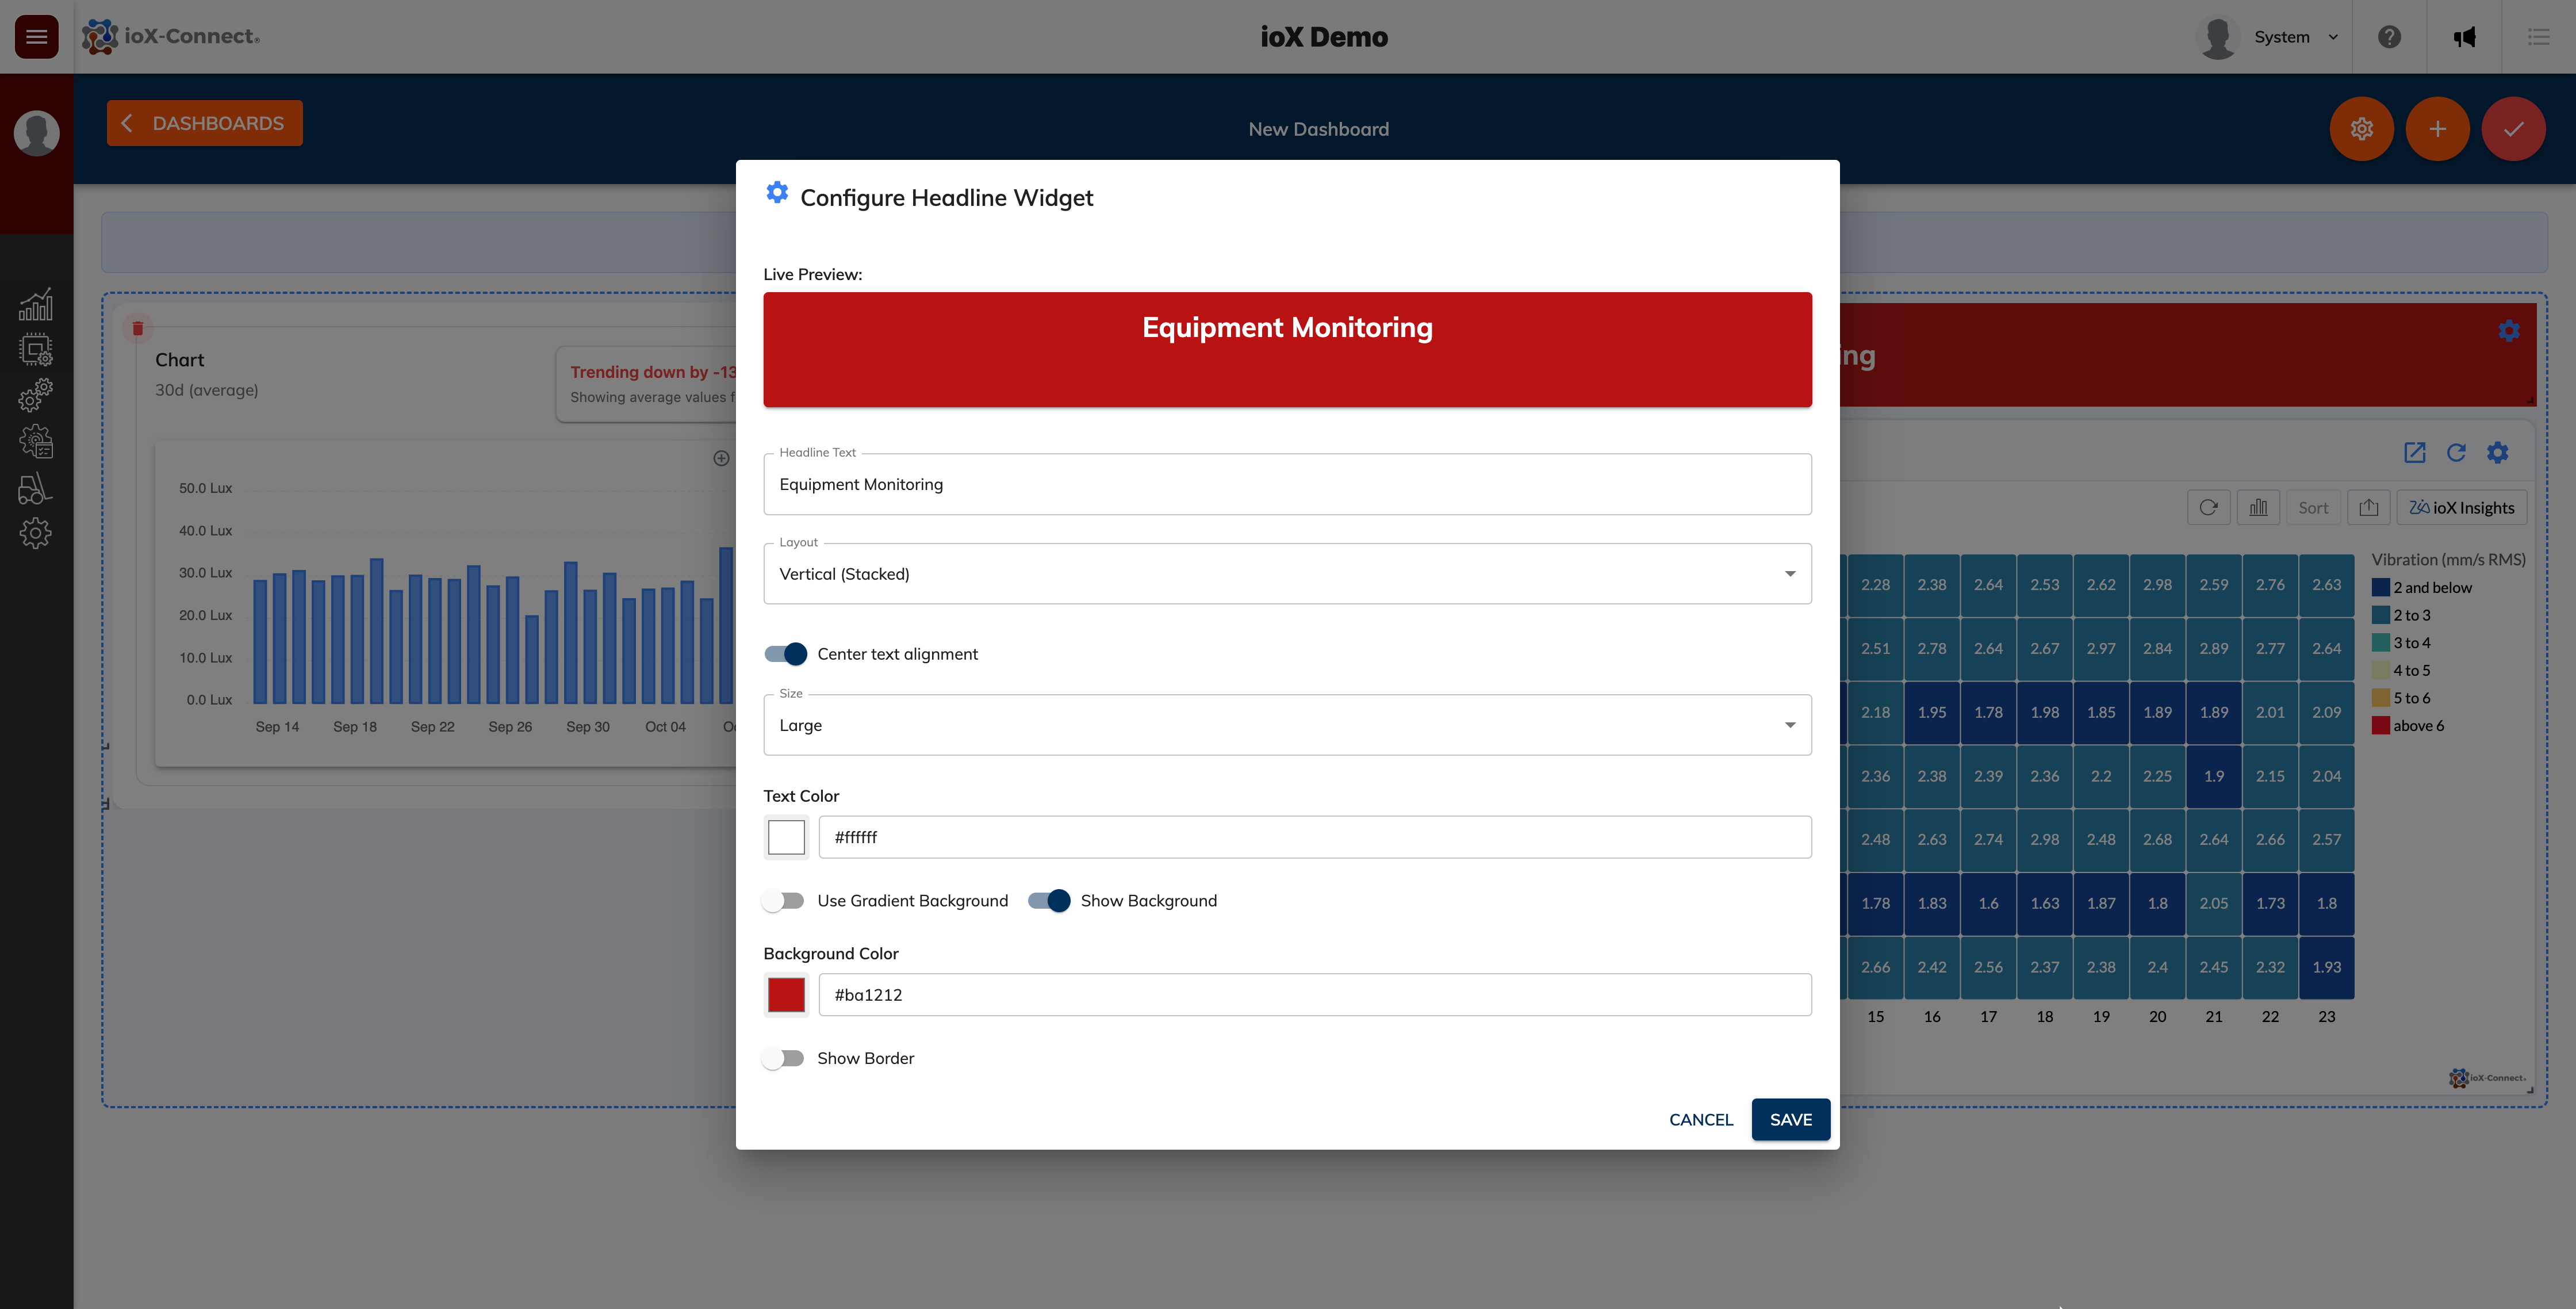
Headline Widget
This widget allows you to display a customizible headline in your dashboard. Useful if you want to split widgets into sections on the dashboard.


Alarm Count Widget
This widget gives users a quick reference for any sensors that are alarming in a particular network. Users can define alarms for this widget like low signal, low battery or if the sensor is alerting.


Coming Up
We’re actively addressing known issues with existing widgets, and we’re also preparing to launch a new suite of gauge widgets—including tank level fill gauges, circular gauges, and more. Over the next few months, you’ll see continuous enhancements to dashboards, along with new widgets added regularly.
Thank you for your continued support and business.
Analytics Enhancements
Developer's Note: We work diligently to release updates that are reliable and issue-free. However, occasional challenges may arise with new system changes. Your feedback is essential—reporting any issues promptly helps us resolve them quickly. If you experience a problem, please contact our support team at support@iox-connect.com so we can assist you as soon as possible.
For those customers with access to advanced analytics and ioX Insights, here are some improvements made:
Key Driver Analysis
We can use both measure and category fields now as influencing factors in key driver analysis. This allows us to select up to five dimensions and three measures to see how they impact your target metric. This only applies to accounts that have Key Driver Analysis activated. Please speak with your account manager if this is of interest to you.
Interpreting the Results of Key Driver Analysis
Key Driver insights help you understand what’s causing changes in your metrics over time. By analyzing trends, outliers, and unusual events, these insights reveal the main factors behind increases or decreases, making it clear why performance shifts occur.

Viewing Diagnostic Insights
The Diagnostic Insights pane offers a comprehensive details of the Potential Drivers that influence the outcome of the Target Metric and the Possible Reasons that could have contributed to the observed trends in the target metric.
To access the insights, click the Diagnosis icon adjacent to any of the time series insights.

Data Bars
Data bars are single-point visual elements that help you quickly compare and analyze values within your data. These bars appear directly into the cells, providing an intuitive indication of relative value, making it easier to spot trends, outliers, and patterns. If you need these added to any of your pivot tables please speak with your account manager.

Exporting a Dashboard to CSV
Most if not all of your analytics dashboards should by default have an export function on the dashboard. Simply click on the export button and select the CSV format. This will download a zipped file top your machine containing csv dumps of all of the charts and widgets within your dashboard.

Bug Fixes - October 7th
The recent release of the sensor list enhancements caused some issues with sensor alarm acknowledging, resetting and alert snoozing. The following fixes where deployed:
- Fixed issue where the alert snooze and reset button did not appear when an alerting or acknowledged sensor was selected in the list.

Enhancements
Gateway Record Updates - October 7th
- Improved UI for gateway heartbeat settings. We got rid of the hearbeat slider functionality
- Added new gateway offline notification functionality that will notify selected personnel if a gateway goes offline
- Added new gateway unplugged notification functionality that will notify selected personnel if a gateway goes from line power to battery power

Network List Updates - October 7th
- We added additional visibility on the sensor network list view. It now shows how many sensors and gateways are linked to a network.
- Next month we will be adding a new network record to provide additional visibility on sensor network health, connected devices with quick access to device records.

Enhancements
Developer's Note: We strive to deliver enhancements that improve your experience and maintain system reliability. While every update is carefully tested, occasional issues may arise. If you encounter any problems, please contact us at support@iox-connect.com so we can resolve them promptly.
Sensor List Enhancements
1. Updated sensor signal strength and battery level visual indicators on sensor grid list view
2. Add Network Groupding/Pivot functionaloity to sensor grid list.

3. Sensor grid/list view filtering has been improved. Filtering a column will now highlight the column. Applied filter(s) will now persist even if user navigates away from sensor list. Filter will reset if colun filter is cleared by user or user logs off.

New Sensor Views Added
We've added two new ways to view and manage your IoT devices. A new sensor card view and a sensor summary table view.

1. Sensor Card View: This view displays sensor summary cards for a better visual presentation of sensor readings, statuses and alarms. It includes quick sensor status filters as well as a network and location filter. This is a very useful view when deplying sensors at a new site. Simply filter on the new network/location and set the quick filter to Offline. As sensors come online for your new site, the sensors will automatically drop off the view.

2. New Sensor Summary Table View: This view gives you quick access to the latest sensor readings, sensor alarms and sensor satuses.

Enhanced Sensor Settings
1. We've added some new improvements to Sensor Settings. We did away with the old sensor heartbeat slider and replaced it with an easier to use and naviagte sensor heartbeat settings function.
2. We've added a new sensor offline notification function. This allows users to set sensor offline notifications by device. This function allows for external users to also receive sensor offline notifications, simply add people to your personnel list and select from the personnel list who should receive the offline notification.


New Configuration Tab
Sensor configuration settings now have their own dedicated tab, separate from the previous sensor settings section. This change enables us to introduce upcoming features, including linear and factor scaling options, as well as sensor certification tracking. These enhancements are expected to be available by the end of next month.

Updated Sensor Create
Some minor updates to the sensor create dialog:
1. We've added a device protocol drop-down. This will be improved in the next month but it will allow customers to provision devices from our new LoRaWAN, NB-IoT/LTE-M and other device ranges very shortly.

2. We updated the UI and layout of fields on the device create dialog with better field alignment. We've also removed the link sensor to asset field from this dialog. Linking a sensor to a location or asset has to be done after create on the sensor record itself.

Bug Fixes
- Improved communication for RF based devices. RF based devices should now communicate to your account much quicker.
- Fixed bug where if sensors or gateways where made inactive and re-activated devices would not come online again and had to be complety deleted and re-added.
- Fixed bug where if sensors got deleted and re-added at a later date, the system would say that the sensor already exists and cannot be added again.
- Fixed issue where if sensors where sent for NIST certification and re-activated, the default heartbeat auto sets to 1 minute. Sensors being re-activated after NIST certification should no longer do this.
Explore our new range of devices
Explore our latest devices and sensors.

LoRaWAN Propane Tank Sensor
Remotely monitor propane tank levels in real time with the ioX-Connect Propane Tank Level Sensor. Compatible with Sr & Jr R3D® Remote Ready gauges, this rugged industrial sensor eliminates unnecessary field visits, prevents run-outs, and improves customer satisfaction.

LoRaWAN Enterprise Temperature, Humidity & PIR Sensor
The ioX-Connect LoRaWAN Enterprise Temperature, Humidity & PIR Sensor delivers accurate indoor environmental and occupancy monitoring in a single device. Designed for smart buildings, offices, and commercial spaces

LoRaWAN Wireless Smart Valve
The ioX-Connect LoRaWAN Wireless Smart Valve is a battery-operated remote shut-off valve designed for leak prevention and smart water management.